Health & Physical Education at University of Connecticut
If you plan to study Health & Physical Education, take a look at what University of Connecticut. Get started with the following essential facts.
University of Connecticut is in Storrs, CT.
For the most recent IPEDS reporting year, 93 health & physical education graduations were recorded at University of Connecticut.
Featured schools near , edit
Online & Distance Learning at University of Connecticut
Online coursework is an option at University of Connecticut. Among 28,306 students, 1,736 (6%) were enrolled entirely in distance education and 7,249 (26%) took at least some classes online.
Health & Physical Education Rankings at University of Connecticut
Rankings can help you compare University of Connecticut’s Health & Physical Education program against peer institutions.
Bachelor’s-Level Rankings
| Ranking | Scope | Rank |
|---|---|---|
| Best Schools (Quality) | Connecticut | #1 of 10 |
| Best Value | Connecticut | #4 of 10 |
| Best Schools (Quality) | New England (Region) | #7 of 48 |
| Best Value | New England (Region) | #18 of 46 |
| Best Schools (Quality) | Nationwide | #57 of 953 |
| Best Value | Nationwide | #672 of 952 |
Master’s-Level Rankings
| Ranking | Scope | Rank |
|---|---|---|
| Best Schools (Quality) | Connecticut | #1 of 10 |
| Best Value | Connecticut | #4 of 10 |
| Best Schools (Quality) | New England (Region) | #7 of 48 |
| Best Value | New England (Region) | #18 of 46 |
| Best Schools (Quality) | Nationwide | #57 of 953 |
| Best Value | Nationwide | #672 of 952 |
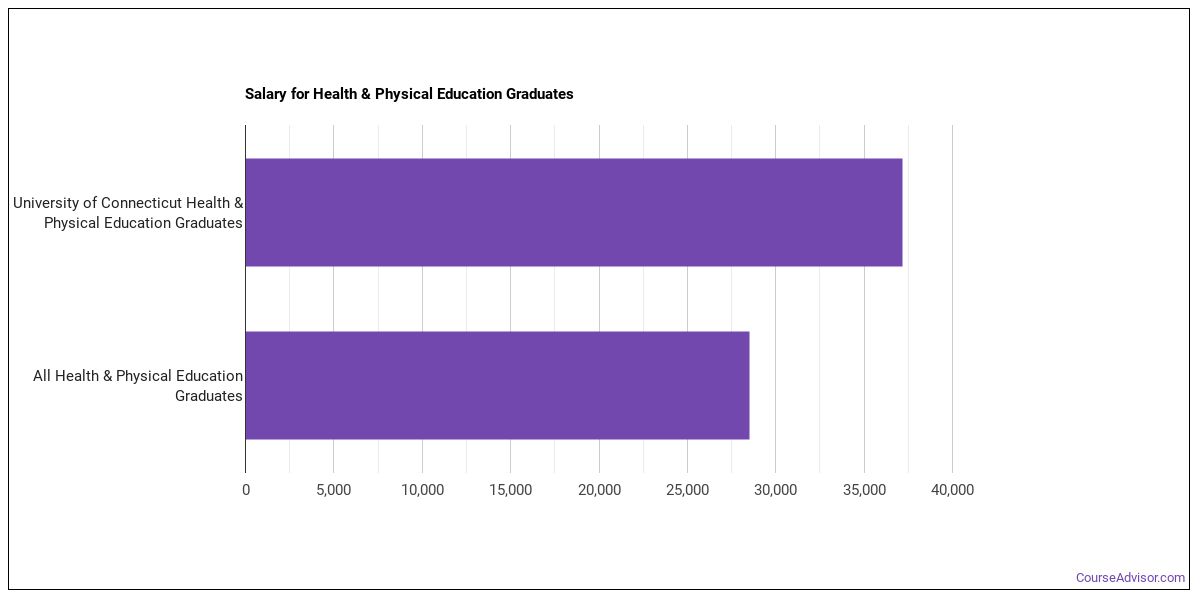
Earnings for Health & Physical Education Graduates from University of Connecticut
Graduates of University of Connecticut’s Health & Physical Education program earn the following amounts (per the U.S. Department of Education’s College Scorecard):
| Years After Graduation | Median Earnings |
|---|---|
| 1 year | $40,201 |
| 2 years | $45,383 |
| 3 years | $50,767 |
| 4 years | $54,097 |
| 5 years | $59,671 |
Is this above or below average for the school? Four years out, Health & Physical Education graduates from University of Connecticut earn a median of $54,097, compared with $74,475 for all University of Connecticut graduates — about 27% lower than the school-wide median.

Median Debt at Graduation
Median student loan debt for Health & Physical Education graduates from University of Connecticut stands at $23,125.
Student Demographics & Diversity
Below you’ll find the composition of Health & Physical Education graduates at University of Connecticut, broken down by degree level.
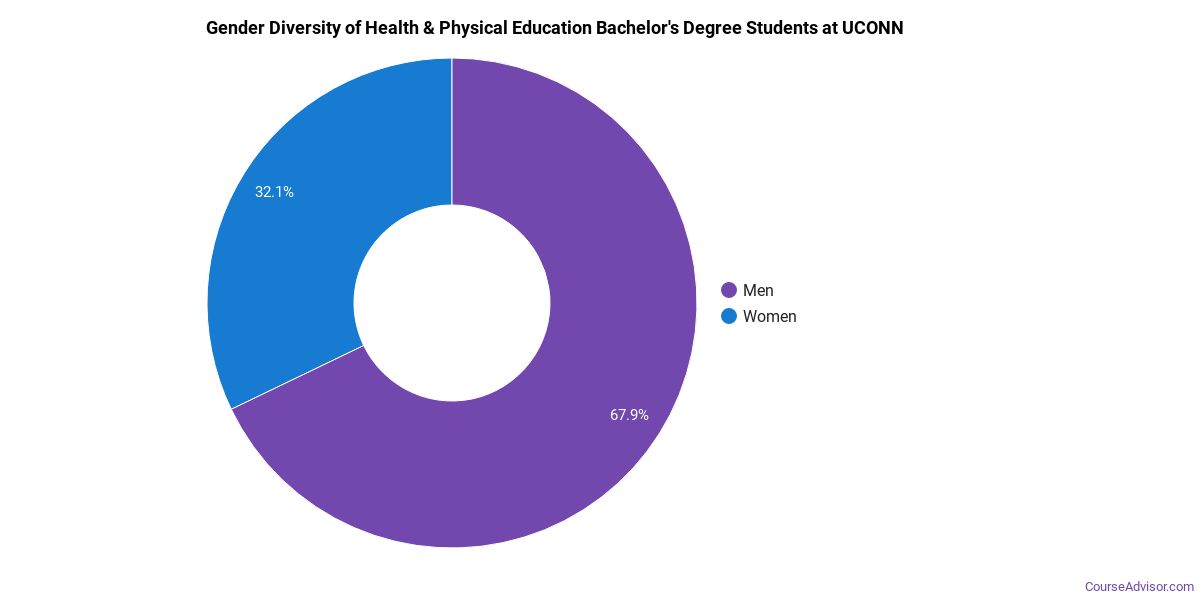
Looking at the program as a whole, Health & Physical Education graduates at University of Connecticut are 42% women (39) and 58% men (54).
Health & Physical Education Bachelor’s Program at University of Connecticut
Among the 56 bachelor’s health & physical education degrees awarded at University of Connecticut, 38% were women (21) and 62% were men (35).
The following table and chart show the race/ethnicity of Health & Physical Education bachelor’s degree recipients at University of Connecticut.
| Race / Ethnicity | Number of Graduates |
|---|---|
| White | 33 |
| Hispanic / Latino | 7 |
| Black / African American | 3 |
| Asian | 2 |
| Two or More Races | 2 |
| International (Nonresident) | 9 |
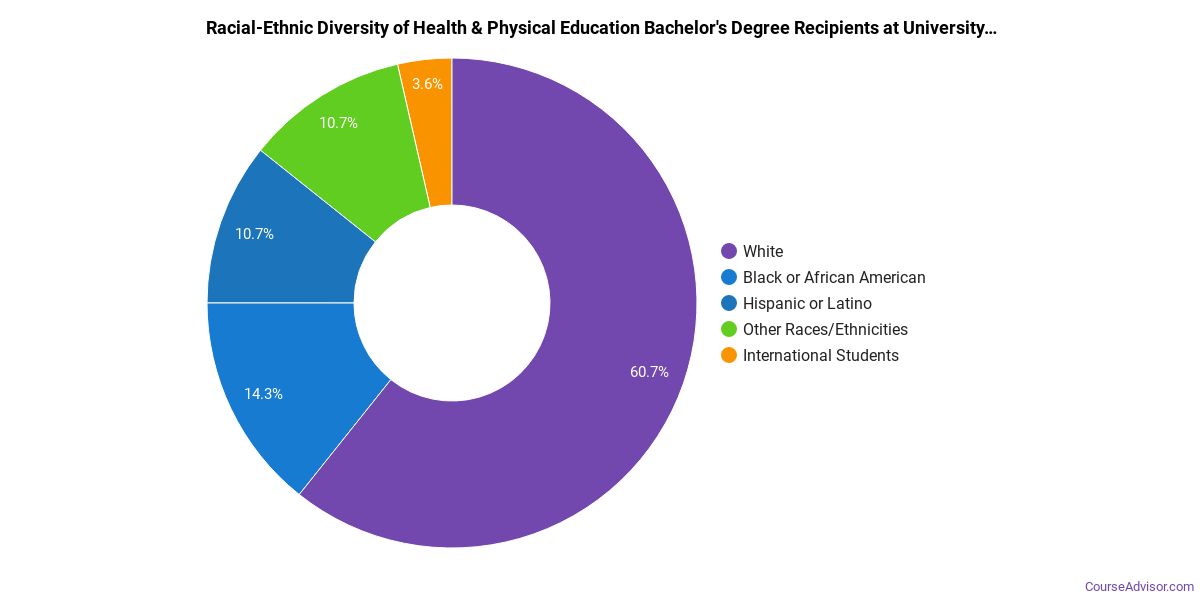
Minority students account for 25% of Health & Physical Education bachelor’s degree recipients at University of Connecticut, lower than the national average of 40%.*
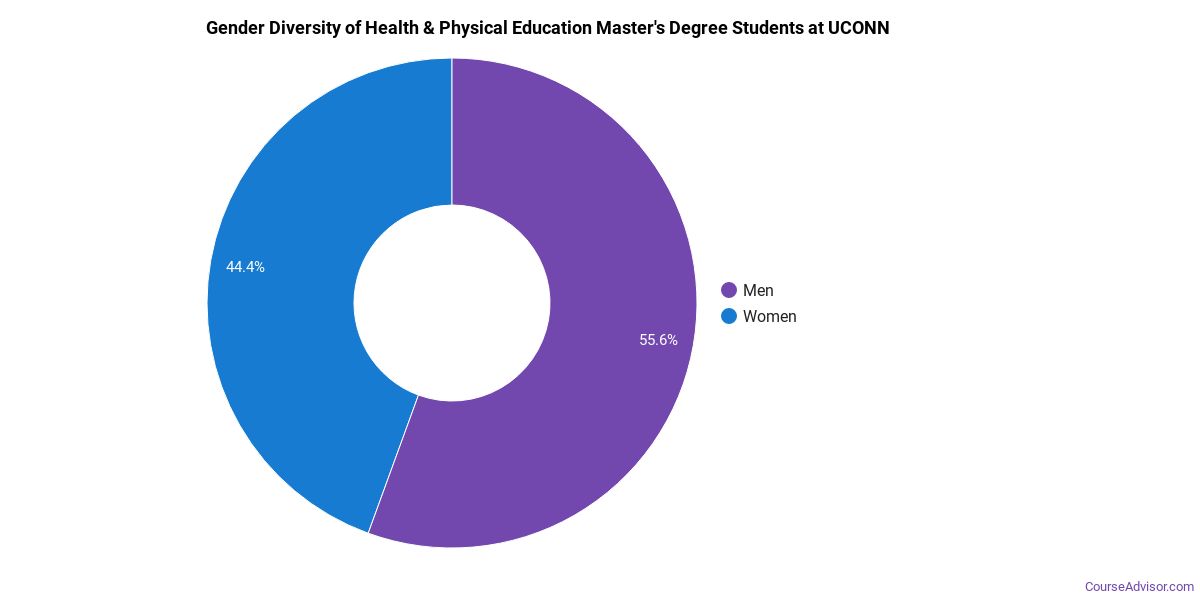
Health & Physical Education Master’s Program at University of Connecticut
Among the 21 master’s health & physical education degrees awarded at University of Connecticut, 38% were women (8) and 62% were men (13).
The following table and chart show the race/ethnicity of Health & Physical Education master’s degree recipients at University of Connecticut.
| Race / Ethnicity | Number of Graduates |
|---|---|
| White | 13 |
| Hispanic / Latino | 1 |
| Black / African American | 5 |
| Asian | 1 |
| International (Nonresident) | 1 |
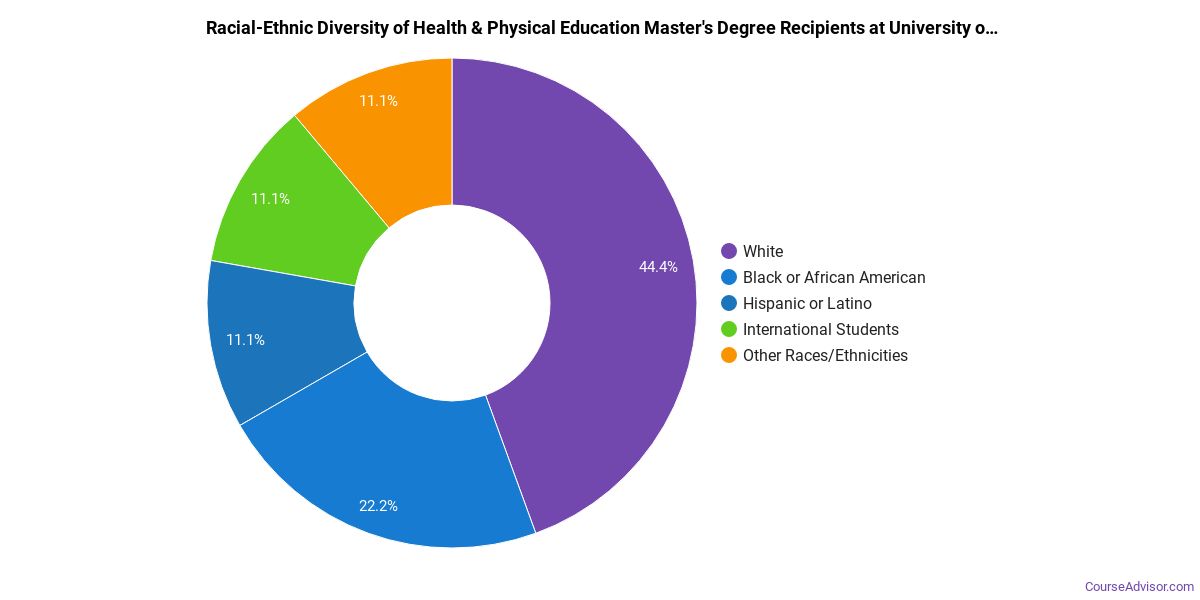
Minority students account for 33% of Health & Physical Education master’s degree recipients at University of Connecticut, lower than the national average of 34%.*
Health & Physical Education Doctoral Program at University of Connecticut
Among the 9 doctoral health & physical education degrees awarded at University of Connecticut, 78% were women (7) and 22% were men (2).

The following table and chart show the race/ethnicity of Health & Physical Education doctoral degree recipients at University of Connecticut.
| Race / Ethnicity | Number of Graduates |
|---|---|
| White | 8 |
| International (Nonresident) | 1 |

*The racial-ethnic minorities figure is the total number of graduates minus White, international (nonresident), and unknown-race graduates.
More Specific Health & Physical Education Concentrations at University of Connecticut
The Health & Physical Education program at University of Connecticut breaks down into more specific concentrations:
| Concentration | Graduates |
|---|---|
| Sports Management | 56 |
| Exercise Science | 37 |
Top-Paying Careers for Health & Physical Education Graduates
Students who finish Health & Physical Education program at University of Connecticut work across a variety of fields. The table below ranks the highest-paying careers for Health & Physical Education graduates, ordered by median annual salary:
| Occupation | Nationwide Median Wage |
|---|---|
| Entertainment and Recreation Managers, Except Gambling | $170,172 |
| Exercise Physiologists | $144,072 |
| Recreation and Fitness Studies Teachers, Postsecondary | $84,688 |
| Athletic Trainers | $79,834 |
| Coaches and Scouts | $78,709 |
| Exercise Trainers and Group Fitness Instructors | $54,441 |
| Athletes and Sports Competitors | $39,714 |
References
- IPEDS — Integrated Postsecondary Education Data System
- U.S. Department of Education — College Scorecard
- O*NET Online (Bureau of Labor Statistics)
- National Center for Education Statistics
More about our data sources and methodologies.
Course Advisor provides higher-education, college and university, degree, program, career, salary, and other helpful information to students, faculty, institutions, and other internet audiences. Presented information and data are subject to change. Inclusion on this website does not imply or represent a direct relationship with the company, school, or brand. Information, though believed correct at time of publication, may not be correct, and no warranty is provided. Contact the schools to verify any information before relying on it. Financial aid may be available for those who qualify. The displayed options may include sponsored or recommended results, not necessarily based on your preferences.
© Course Advisor – All Rights Reserved.