Health & Physical Education at Tiffin University
If you are interested in studying Health & Physical Education, consider the program at Tiffin University. Get started with the following essential facts.
Tiffin University is in Tiffin, OH.
For the most recent IPEDS reporting year, 60 health & physical education degrees were awarded at Tiffin University.
Featured schools near , edit
Online & Distance Learning at Tiffin University
Distance learning is available at Tiffin University. Of 3,831 students, 1,230 (32%) studied exclusively online and 1,178 (31%) took at least some classes online.
Median Debt at Graduation
Typical debt at graduation for Health & Physical Education graduates from Tiffin University stands at $27,000.
Student Demographics & Diversity
The following sections describe the diversity of Health & Physical Education graduates at Tiffin University, by degree type.
Across all degree levels, Health & Physical Education graduates at Tiffin University are 32% women (19) and 68% men (41).
Health & Physical Education Bachelor’s Program at Tiffin University
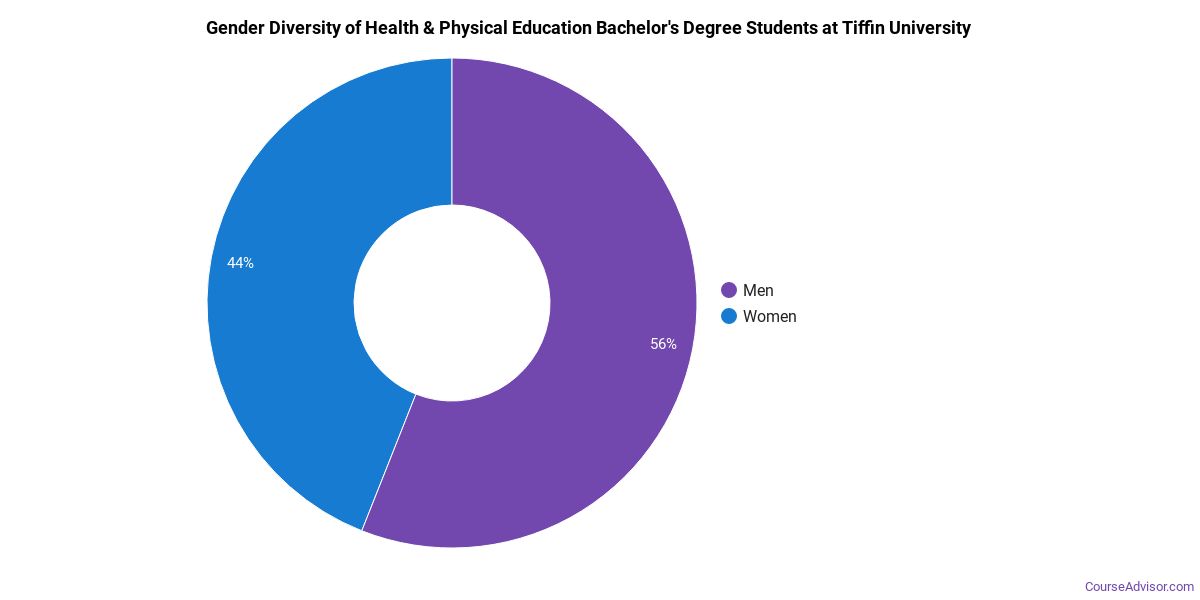
Of the 36 bachelor’s health & physical education graduates at Tiffin University, 28% were women (10) and 72% were men (26).
The following table and chart show the race/ethnicity of Health & Physical Education bachelor’s degree recipients at Tiffin University.
| Race / Ethnicity | Number of Graduates |
|---|---|
| White | 13 |
| Hispanic / Latino | 3 |
| Black / African American | 8 |
| International (Nonresident) | 9 |
| Unknown | 3 |
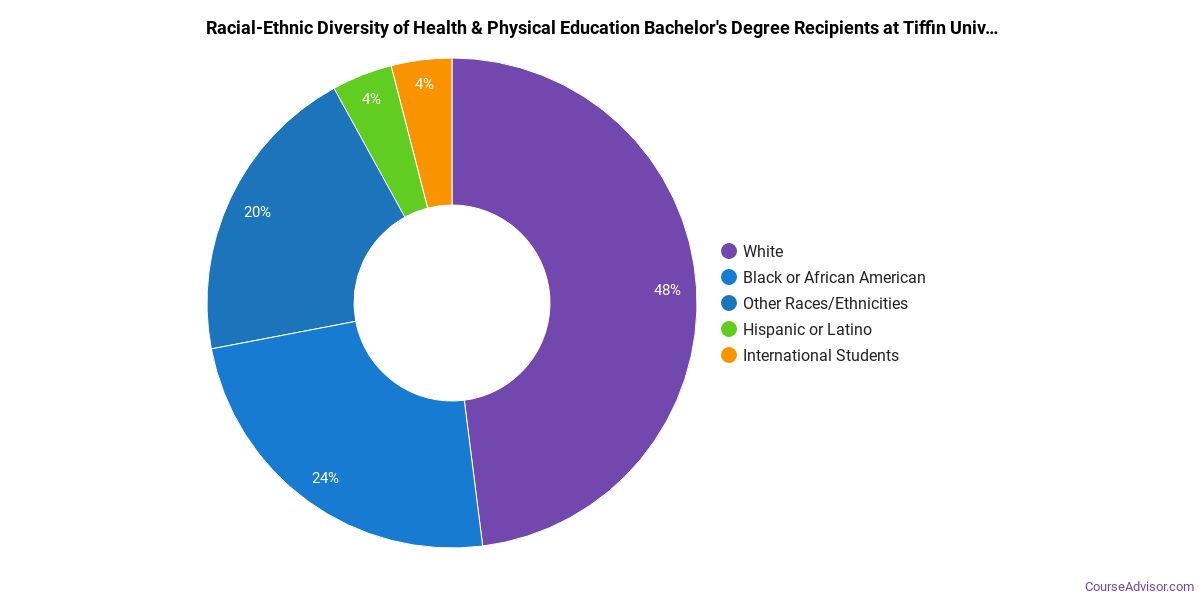
Racial-ethnic minorities make up 31% of Health & Physical Education bachelor’s degree recipients at Tiffin University, lower than the national average of 40%.*
Health & Physical Education Master’s Program at Tiffin University
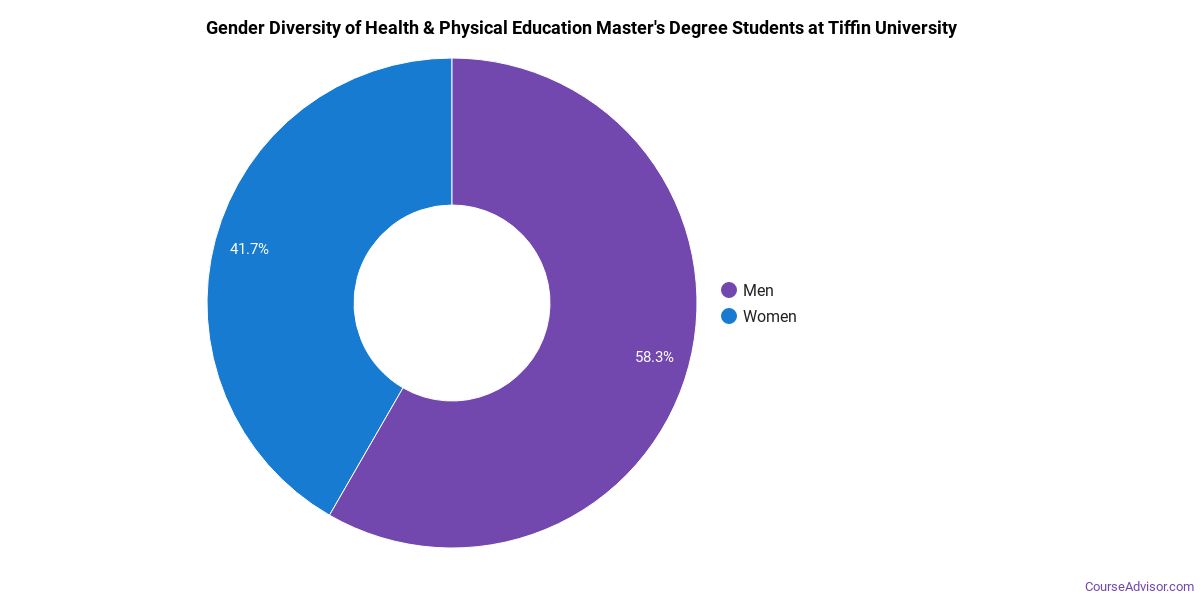
Of the 24 master’s health & physical education degrees awarded at Tiffin University, 38% were women (9) and 62% were men (15).
The following table and chart show the race/ethnicity of Health & Physical Education master’s degree recipients at Tiffin University.
| Race / Ethnicity | Number of Graduates |
|---|---|
| White | 11 |
| Hispanic / Latino | 1 |
| Black / African American | 8 |
| International (Nonresident) | 3 |
| Unknown | 1 |
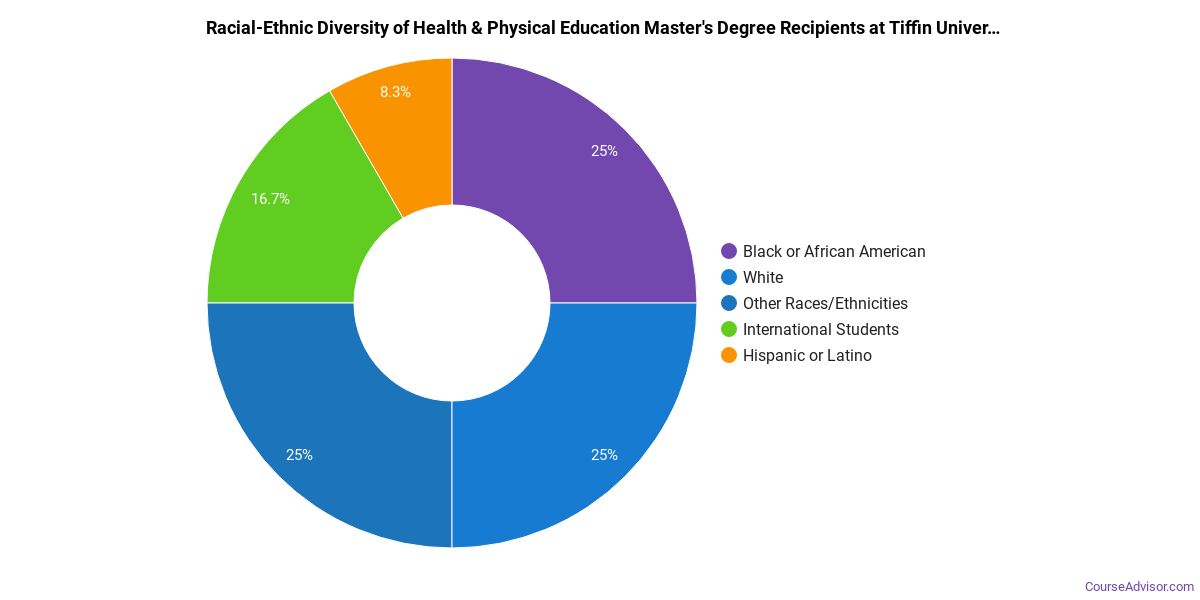
Minority students account for 38% of Health & Physical Education master’s degree recipients at Tiffin University, higher than the national average of 34%.*
*The racial-ethnic minorities figure is the total number of graduates minus White, international (nonresident), and unknown-race graduates.
More Specific Health & Physical Education Concentrations at Tiffin University
The Health & Physical Education program at Tiffin University offers more specialized concentrations:
| Concentration | Graduates |
|---|---|
| Physical Education | 9 |
| Sports Management | 50 |
| Sports Studies | 1 |
Highest-Paying Careers for Health & Physical Education Graduates
Those who complete Health & Physical Education program at Tiffin University pursue many career paths. Below are the top-paying careers for Health & Physical Education graduates, ordered by median annual salary:
| Occupation | Nationwide Median Wage |
|---|---|
| Entertainment and Recreation Managers, Except Gambling | $170,172 |
| Exercise Physiologists | $144,072 |
| Recreation and Fitness Studies Teachers, Postsecondary | $84,688 |
| Athletic Trainers | $79,834 |
| Coaches and Scouts | $78,709 |
| Exercise Trainers and Group Fitness Instructors | $54,441 |
| Athletes and Sports Competitors | $39,714 |
References
- IPEDS — Integrated Postsecondary Education Data System
- U.S. Department of Education — College Scorecard
- O*NET Online (Bureau of Labor Statistics)
- National Center for Education Statistics
More about our data sources and methodologies.
Course Advisor provides higher-education, college and university, degree, program, career, salary, and other helpful information to students, faculty, institutions, and other internet audiences. Presented information and data are subject to change. Inclusion on this website does not imply or represent a direct relationship with the company, school, or brand. Information, though believed correct at time of publication, may not be correct, and no warranty is provided. Contact the schools to verify any information before relying on it. Financial aid may be available for those who qualify. The displayed options may include sponsored or recommended results, not necessarily based on your preferences.
© Course Advisor – All Rights Reserved.