General Visual & Performing Arts at The University of Montana
What traits are you looking for in a school for General Visual & Performing Arts, you may want to check out the program at The University of Montana. Get started with the following essential facts.
The University of Montana sits in Missoula, MT.
For the most recent IPEDS reporting year, 8 general visual & performing arts graduations were recorded at The University of Montana.
Featured schools near , edit
Studying Online at The University of Montana
Distance learning is available at The University of Montana. Among 10,811 students, 2,398 (22%) studied exclusively online and 3,174 (29%) took at least some classes online.
General Visual & Performing Arts Rankings at The University of Montana
Rankings can help you compare The University of Montana’s General Visual & Performing Arts program to other colleges that offer this major.
Earnings for General Visual & Performing Arts Graduates from The University of Montana
Graduates of The University of Montana’s General Visual & Performing Arts program earn at the following median levels (per the U.S. Department of Education’s College Scorecard):
| Years After Graduation | Median Earnings |
|---|---|
| 1 year | $52,377 |
Student Demographics & Diversity
The following sections describe the composition of General Visual & Performing Arts graduates at The University of Montana, broken down by degree level.
Program-wide, General Visual & Performing Arts graduates at The University of Montana are 75% women (6) and 25% men (2).
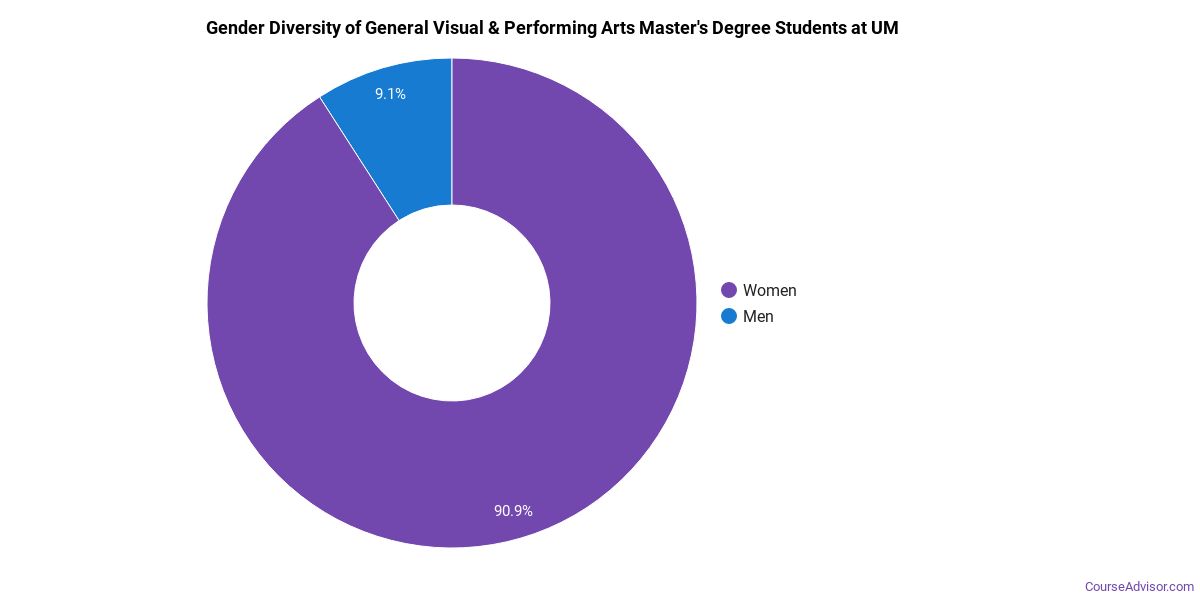
General Visual & Performing Arts Master’s Program at The University of Montana
Of the 8 master’s general visual & performing arts degrees awarded at The University of Montana, 75% were women (6) and 25% were men (2).
The following table and chart show the race/ethnicity of General Visual & Performing Arts master’s degree recipients at The University of Montana.
| Race / Ethnicity | Number of Graduates |
|---|---|
| White | 8 |
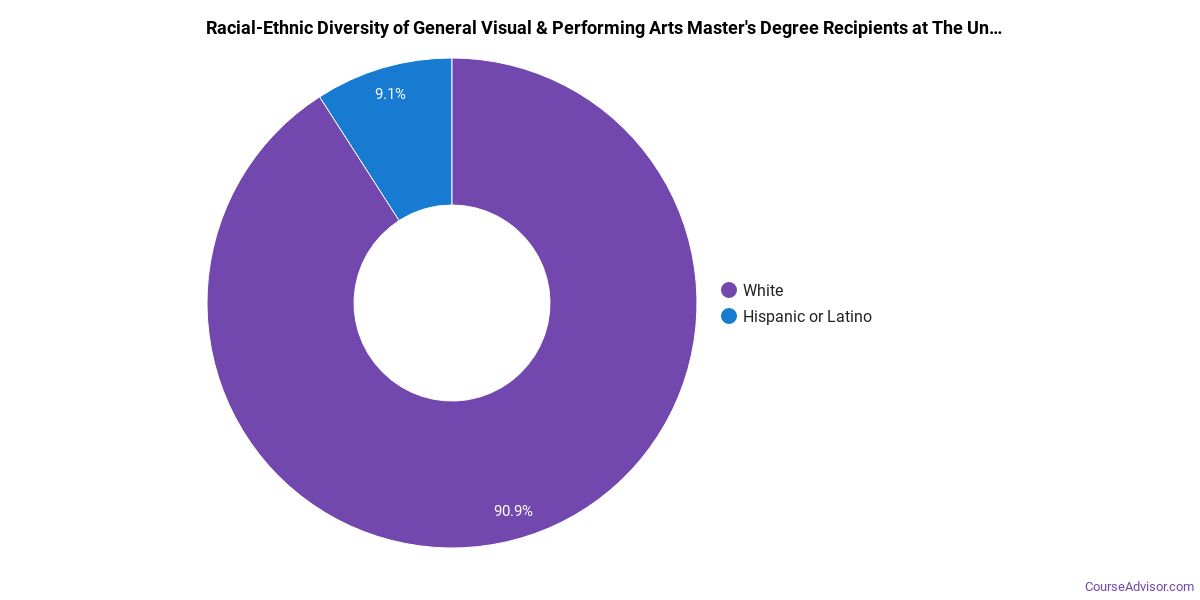
*The racial-ethnic minorities figure is the total number of graduates minus White, international (nonresident), and unknown-race graduates.
More Specific General Visual & Performing Arts Concentrations at The University of Montana
This General Visual & Performing Arts program at The University of Montana breaks down into more specific concentrations:
| Concentration | Graduates |
|---|---|
| Visual & Performing Arts | 8 |
Best-Paid Careers for General Visual & Performing Arts Graduates
Students who finish General Visual & Performing Arts program at The University of Montana go on to a range of careers. The table below ranks the top-paying careers for General Visual & Performing Arts graduates, ordered by median annual salary:
| Occupation | Nationwide Median Wage |
|---|---|
| Art Directors | $103,285 |
| Artists and Related Workers, All Other | $83,610 |
| Craft Artists | $76,826 |
| Photographers | $75,743 |
| Fine Artists, Including Painters, Sculptors, and Illustrators | $69,338 |
| Graphic Designers | $66,386 |
| Special Effects Artists and Animators | $57,836 |
| Art, Drama, and Music Teachers, Postsecondary | $46,983 |
References
- IPEDS — Integrated Postsecondary Education Data System
- U.S. Department of Education — College Scorecard
- O*NET Online (Bureau of Labor Statistics)
- National Center for Education Statistics
More about our data sources and methodologies.
Course Advisor provides higher-education, college and university, degree, program, career, salary, and other helpful information to students, faculty, institutions, and other internet audiences. Presented information and data are subject to change. Inclusion on this website does not imply or represent a direct relationship with the company, school, or brand. Information, though believed correct at time of publication, may not be correct, and no warranty is provided. Contact the schools to verify any information before relying on it. Financial aid may be available for those who qualify. The displayed options may include sponsored or recommended results, not necessarily based on your preferences.
© Course Advisor – All Rights Reserved.