Health & Physical Education at San Jose State University
If you plan to study Health & Physical Education, consider the program at San Jose State University. Get started with the following essential facts.
San Jose State University sits in San Jose, CA.
During the most recent reporting year, 281 health & physical education degrees were awarded at San Jose State University.
Featured schools near , edit
Studying Online at San Jose State University
Many students take online classes at San Jose State University. Of 37,661 students, 6,027 (16%) studied exclusively online and 17,894 (48%) took at least some classes online.
Health & Physical Education Rankings at San Jose State University
Rankings can help you compare San Jose State University’s Health & Physical Education program to other colleges that offer this major.
Bachelor’s-Level Rankings
| Ranking | Scope | Rank |
|---|---|---|
| Best Schools (Quality) | California | #1 of 121 |
| Best Schools (Quality) | Far Western (Region) | #1 of 151 |
| Best Schools (Quality) | Nationwide | #10 of 953 |
| Best Value | California | #84 of 121 |
| Best Value | Far Western (Region) | #89 of 151 |
| Best Value | Nationwide | #173 of 952 |
Master’s-Level Rankings
| Ranking | Scope | Rank |
|---|---|---|
| Best Schools (Quality) | California | #1 of 121 |
| Best Schools (Quality) | Far Western (Region) | #1 of 151 |
| Best Schools (Quality) | Nationwide | #10 of 953 |
| Best Value | California | #84 of 121 |
| Best Value | Far Western (Region) | #89 of 151 |
| Best Value | Nationwide | #173 of 952 |
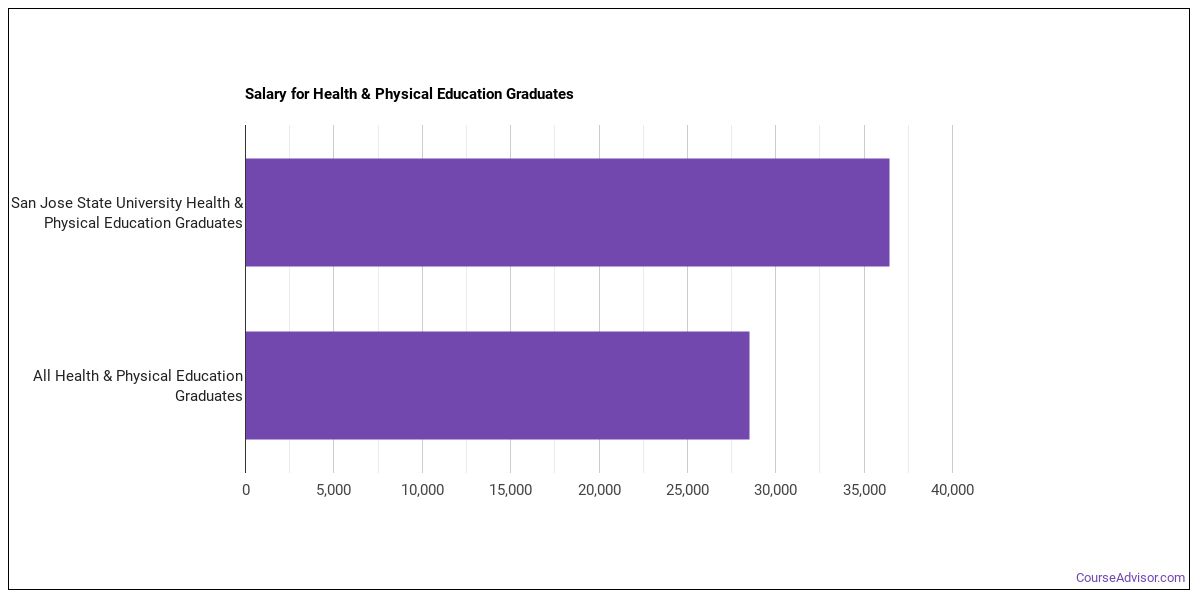
Earnings for Health & Physical Education Graduates from San Jose State University
Those who finish San Jose State University’s Health & Physical Education program report the following median earnings (per the U.S. Department of Education’s College Scorecard):
| Years After Graduation | Median Earnings |
|---|---|
| 1 year | $37,093 |
| 2 years | $34,404 |
| 3 years | $52,776 |
| 4 years | $58,866 |
| 5 years | $69,505 |
How do these earnings stack up against the rest of the school? At the four-year mark, Health & Physical Education graduates from San Jose State University report median earnings of $58,866, compared with $83,861 for all San Jose State University graduates — about 30% lower than the school-wide median.

Student Demographics & Diversity
The following sections describe the composition of Health & Physical Education graduates at San Jose State University, by degree type.
Program-wide, Health & Physical Education graduates at San Jose State University are 46% women (130) and 54% men (151).
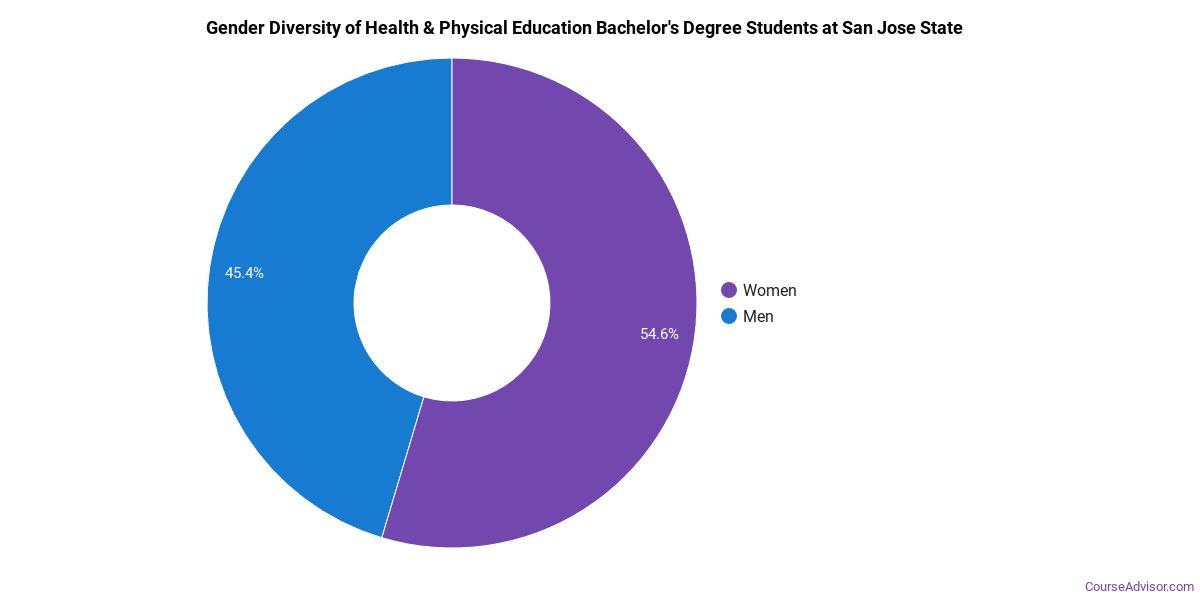
Health & Physical Education Bachelor’s Program at San Jose State University
Of the 261 bachelor’s health & physical education degrees awarded at San Jose State University, 45% were women (117) and 55% were men (144).
The following table and chart show the race/ethnicity of Health & Physical Education bachelor’s degree recipients at San Jose State University.
| Race / Ethnicity | Number of Graduates |
|---|---|
| White | 31 |
| Hispanic / Latino | 108 |
| Black / African American | 9 |
| Asian | 86 |
| Native Hawaiian / Pacific Islander | 2 |
| Two or More Races | 19 |
| International (Nonresident) | 1 |
| Unknown | 5 |
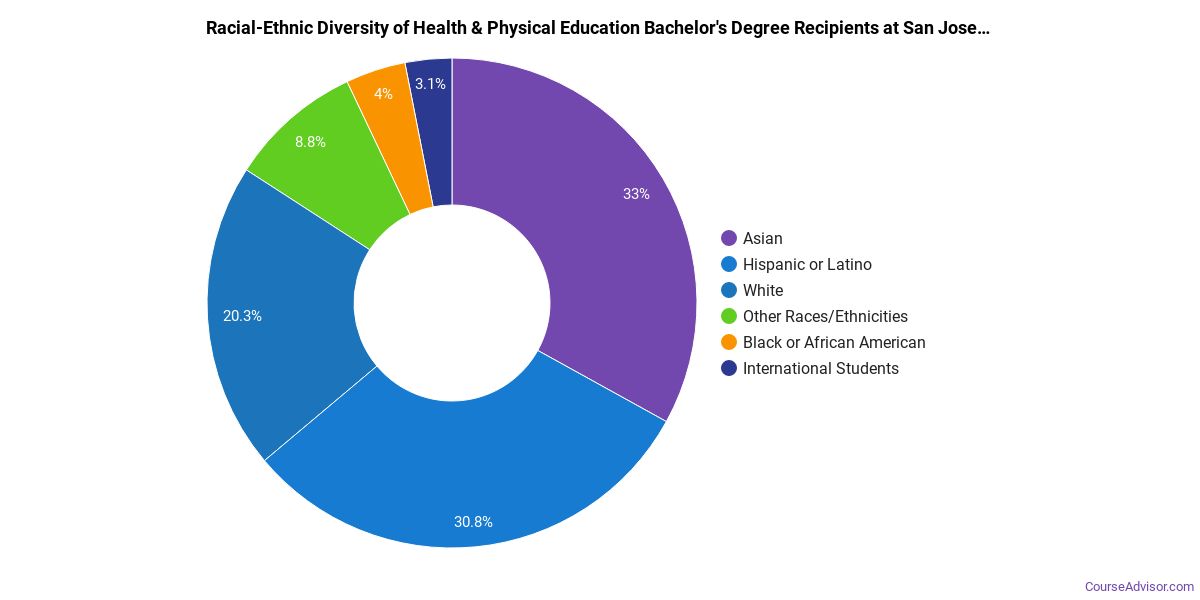
Minority students account for 86% of Health & Physical Education bachelor’s degree recipients at San Jose State University, higher than the national average of 40%.*
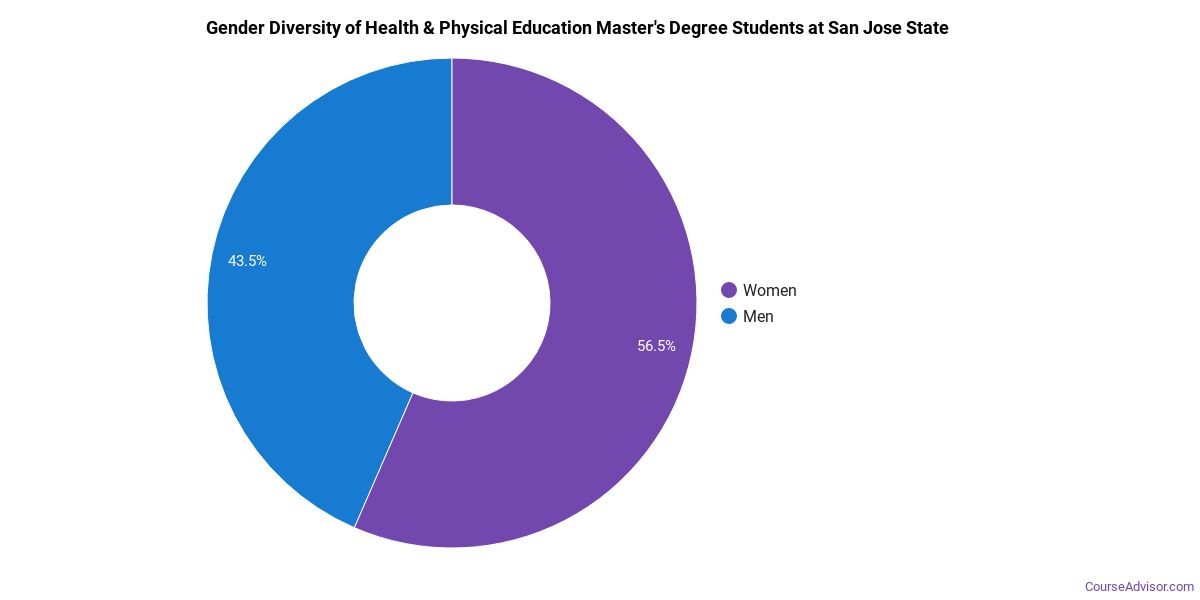
Health & Physical Education Master’s Program at San Jose State University
Of the 20 master’s health & physical education graduates at San Jose State University, 65% were women (13) and 35% were men (7).
The following table and chart show the race/ethnicity of Health & Physical Education master’s degree recipients at San Jose State University.
| Race / Ethnicity | Number of Graduates |
|---|---|
| White | 5 |
| Hispanic / Latino | 6 |
| Asian | 3 |
| International (Nonresident) | 5 |
| Unknown | 1 |
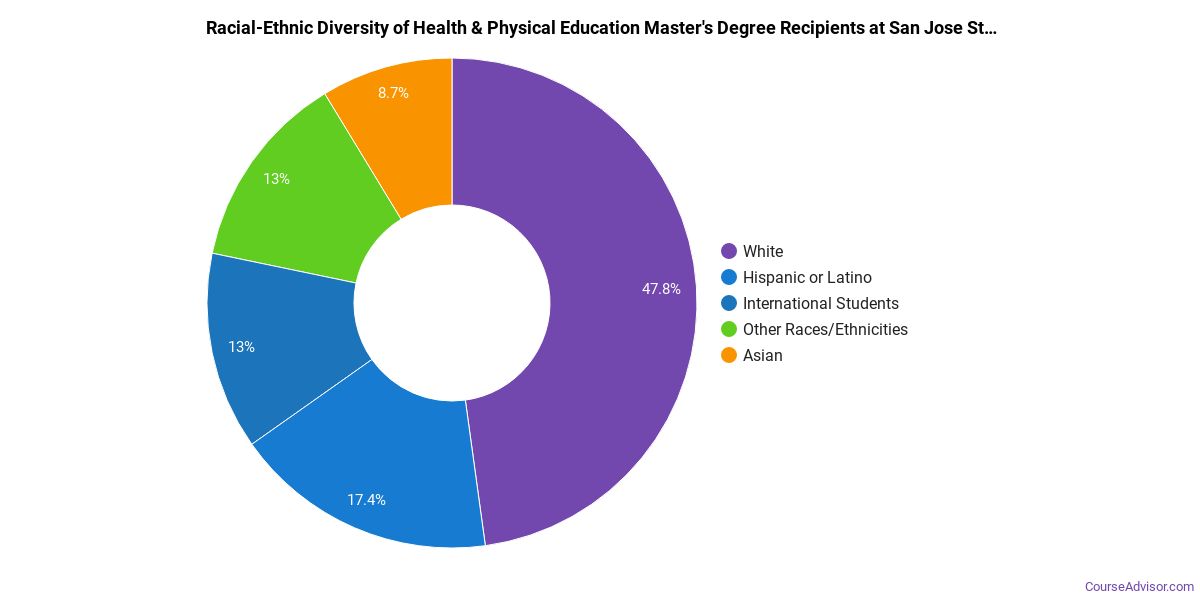
Minority students account for 45% of Health & Physical Education master’s degree recipients at San Jose State University, above the national average of 34%.*
*The racial-ethnic minorities figure is the total number of graduates minus White, international (nonresident), and unknown-race graduates.
More Specific Health & Physical Education Concentrations at San Jose State University
This Health & Physical Education program at San Jose State University offers more specialized concentrations:
| Concentration | Graduates |
|---|---|
| Physical Education | 281 |
Best-Paid Careers for Health & Physical Education Graduates
Graduates of the Health & Physical Education program at San Jose State University work across a variety of fields. The table below ranks the best-paid careers for Health & Physical Education majors, ordered by median annual salary:
| Occupation | Nationwide Median Wage |
|---|---|
| Entertainment and Recreation Managers, Except Gambling | $170,172 |
| Exercise Physiologists | $144,072 |
| Recreation and Fitness Studies Teachers, Postsecondary | $84,688 |
| Athletic Trainers | $79,834 |
| Coaches and Scouts | $78,709 |
| Exercise Trainers and Group Fitness Instructors | $54,441 |
| Athletes and Sports Competitors | $39,714 |
References
- IPEDS — Integrated Postsecondary Education Data System
- U.S. Department of Education — College Scorecard
- O*NET Online (Bureau of Labor Statistics)
- National Center for Education Statistics
More about our data sources and methodologies.
Course Advisor provides higher-education, college and university, degree, program, career, salary, and other helpful information to students, faculty, institutions, and other internet audiences. Presented information and data are subject to change. Inclusion on this website does not imply or represent a direct relationship with the company, school, or brand. Information, though believed correct at time of publication, may not be correct, and no warranty is provided. Contact the schools to verify any information before relying on it. Financial aid may be available for those who qualify. The displayed options may include sponsored or recommended results, not necessarily based on your preferences.
© Course Advisor – All Rights Reserved.