Civil Engineering at San Jose State University
If you are interested in studying Civil Engineering, consider the program at San Jose State University. Get started with the following essential facts.
San Jose State University sits in San Jose, CA.
During the most recent reporting year, 132 civil engineering degrees were granted at San Jose State University.
Featured schools near , edit
Online Class Availability at San Jose State University
Many students take online classes at San Jose State University. Among 37,661 students, 6,027 (16%) studied exclusively online and 17,894 (48%) took at least some classes online.
Civil Engineering Rankings at San Jose State University
These rankings give you a sense of how San Jose State University’s Civil Engineering program to other colleges that offer this major.
Bachelor’s-Level Rankings
| Ranking | Scope | Rank |
|---|---|---|
| Best Schools (Quality) | California | #5 of 23 |
| Best Schools (Quality) | Far Western (Region) | #6 of 37 |
| Best Schools (Quality) | Nationwide | #11 of 254 |
| Best Value | California | #11 of 23 |
| Best Value | Far Western (Region) | #15 of 37 |
| Best Value | Nationwide | #30 of 254 |
Master’s-Level Rankings
| Ranking | Scope | Rank |
|---|---|---|
| Best Schools (Quality) | California | #5 of 23 |
| Best Schools (Quality) | Far Western (Region) | #6 of 37 |
| Best Schools (Quality) | Nationwide | #11 of 254 |
| Best Value | California | #11 of 23 |
| Best Value | Far Western (Region) | #15 of 37 |
| Best Value | Nationwide | #30 of 254 |
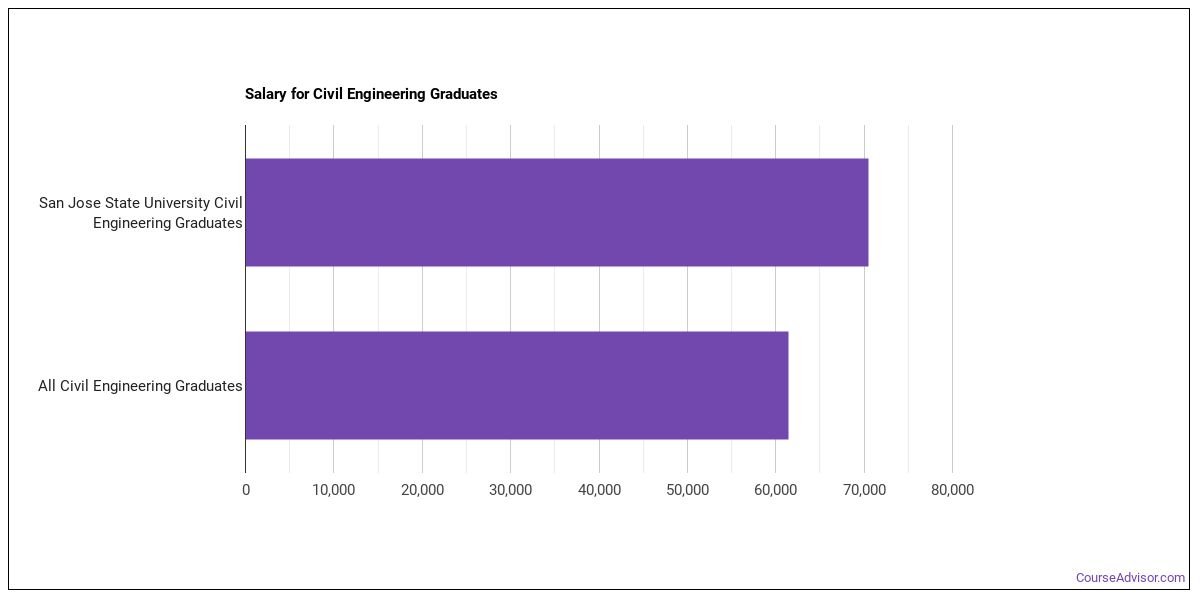
Earnings for Civil Engineering Graduates from San Jose State University
Graduates of San Jose State University’s Civil Engineering program report the following median earnings (per the U.S. Department of Education’s College Scorecard):
| Years After Graduation | Median Earnings |
|---|---|
| 1 year | $70,515 |
| 2 years | $75,542 |
| 3 years | $84,385 |
| 4 years | $98,986 |
| 5 years | $108,402 |
How does this compare to the school overall? At the four-year mark, Civil Engineering graduates from San Jose State University take home a median $98,986, compared with $83,861 for all San Jose State University graduates — about 18% higher than the school-wide median.

Student Demographics & Diversity
Take a look at the diversity of Civil Engineering graduates at San Jose State University, broken down by degree level.
Program-wide, Civil Engineering graduates at San Jose State University are 33% women (43) and 67% men (89).
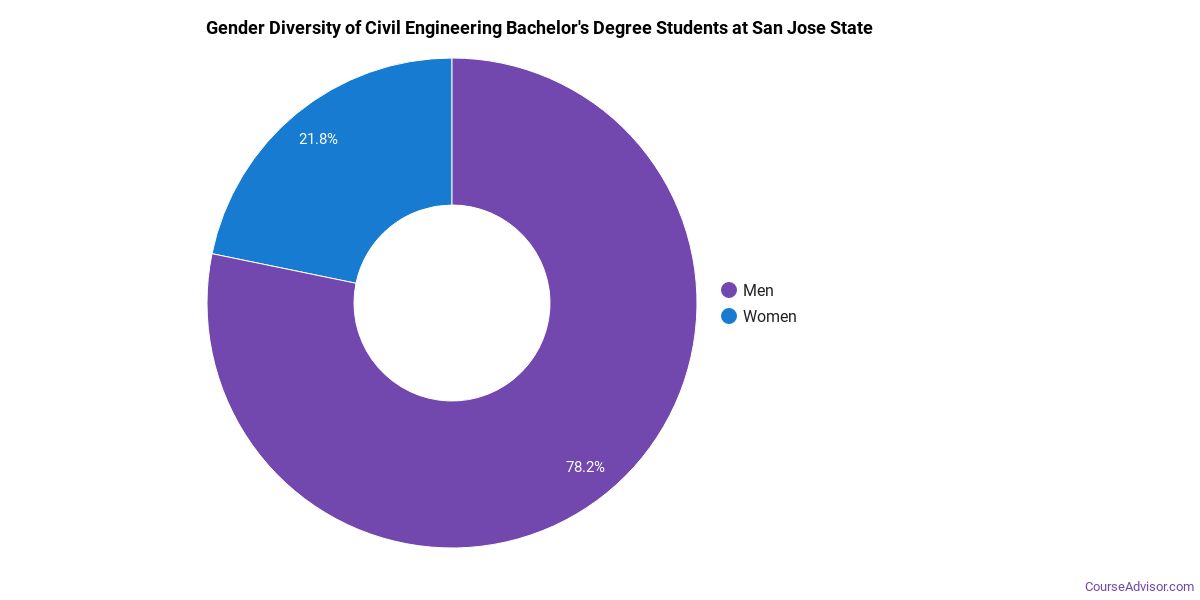
Civil Engineering Bachelor’s Program at San Jose State University
Of the 96 bachelor’s civil engineering graduates at San Jose State University, 33% were women (32) and 67% were men (64).
The following table and chart show the race/ethnicity of Civil Engineering bachelor’s degree recipients at San Jose State University.
| Race / Ethnicity | Number of Graduates |
|---|---|
| White | 8 |
| Hispanic / Latino | 38 |
| Asian | 38 |
| Native Hawaiian / Pacific Islander | 1 |
| Two or More Races | 3 |
| International (Nonresident) | 5 |
| Unknown | 3 |
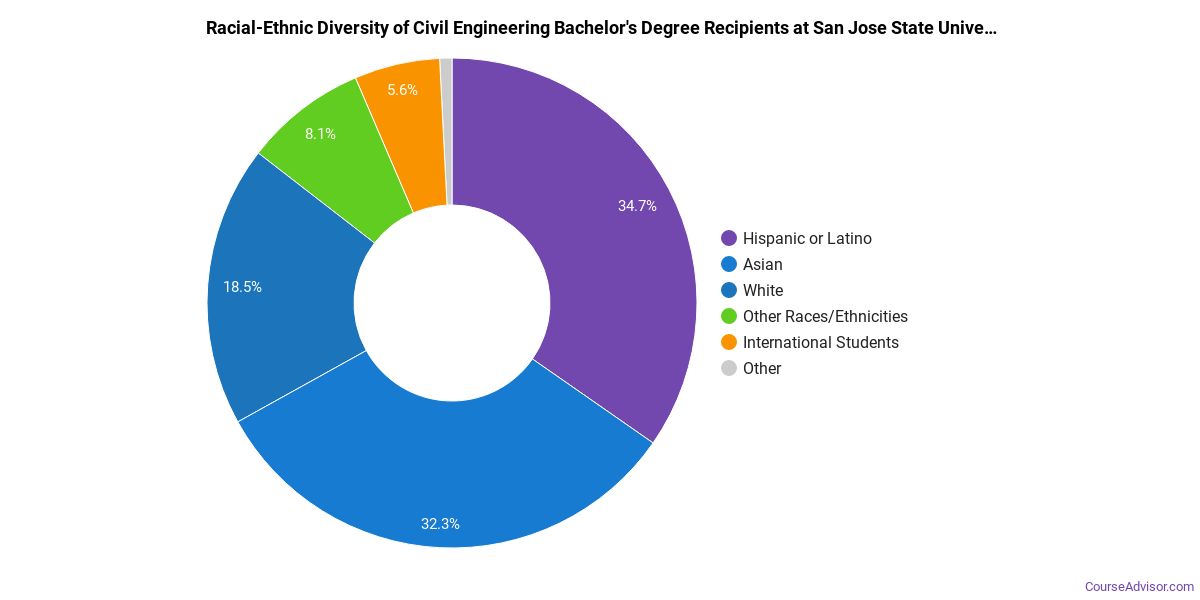
Minority students account for 83% of Civil Engineering bachelor’s degree recipients at San Jose State University, higher than the national average of 38%.*
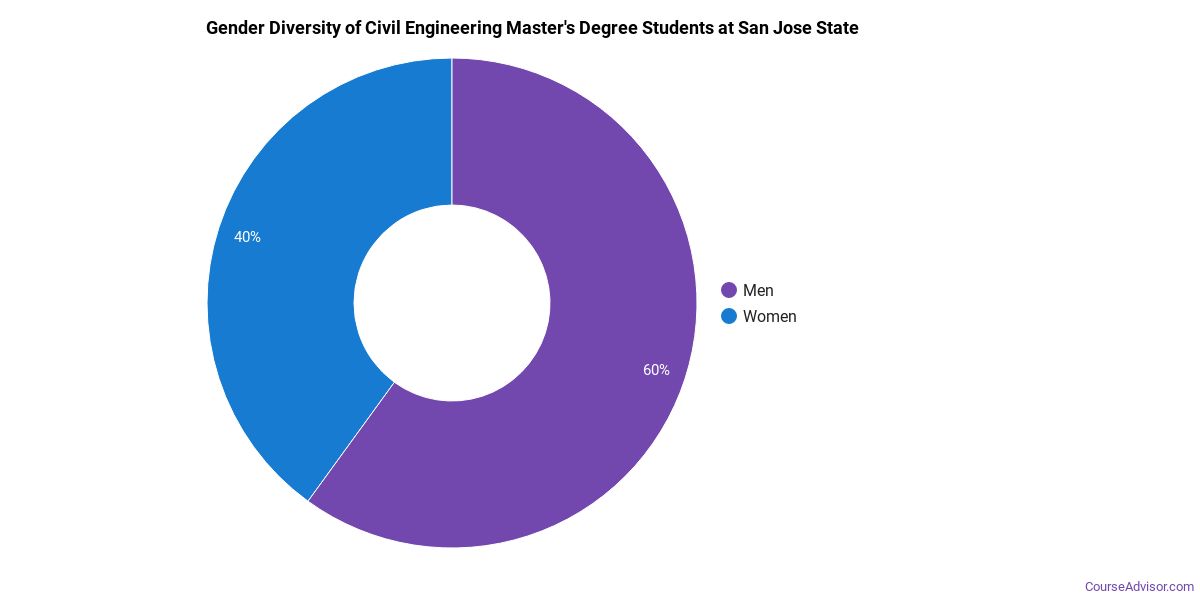
Civil Engineering Master’s Program at San Jose State University
Of the 36 master’s civil engineering graduates at San Jose State University, 31% were women (11) and 69% were men (25).
The following table and chart show the race/ethnicity of Civil Engineering master’s degree recipients at San Jose State University.
| Race / Ethnicity | Number of Graduates |
|---|---|
| White | 5 |
| Hispanic / Latino | 3 |
| Black / African American | 1 |
| Asian | 15 |
| International (Nonresident) | 11 |
| Unknown | 1 |
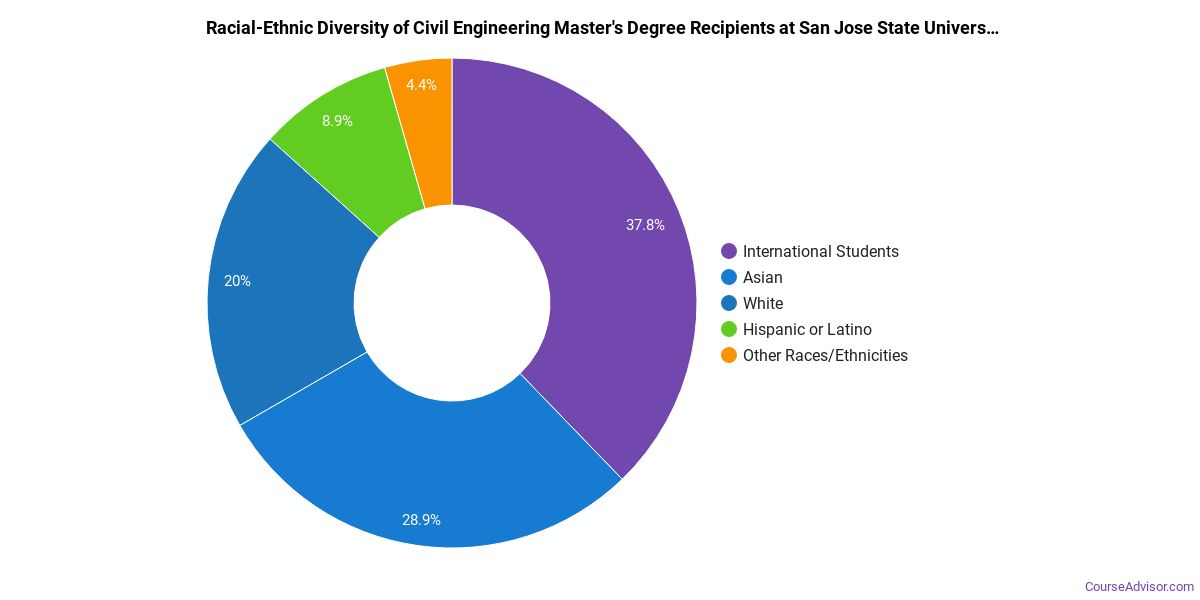
Minority students account for 53% of Civil Engineering master’s degree recipients at San Jose State University, higher than the national average of 19%.*
*The racial-ethnic minorities figure is the total number of graduates minus White, international (nonresident), and unknown-race graduates.
More Specific Civil Engineering Concentrations at San Jose State University
The Civil Engineering program at San Jose State University breaks down into more specific concentrations:
| Concentration | Graduates |
|---|---|
| General Civil Engineering | 132 |
Top-Paying Careers for Civil Engineering Graduates
Graduates of the Civil Engineering program at San Jose State University pursue many career paths. Here are the top-paying careers for Civil Engineering graduates, ordered by median annual salary:
| Occupation | Nationwide Median Wage |
|---|---|
| Mining and Geological Engineers, Including Mining Safety Engineers | $138,303 |
| Petroleum Engineers | $137,336 |
| Engineers, All Other | $136,628 |
| Transportation Engineers | $120,210 |
| Solar Energy Systems Engineers | $116,775 |
| Mechatronics Engineers | $115,569 |
| Microsystems Engineers | $104,558 |
| Architectural and Engineering Managers | $101,277 |
| Wind Energy Engineers | $98,460 |
| Biofuels/Biodiesel Technology and Product Development Managers | $89,263 |
References
- IPEDS — Integrated Postsecondary Education Data System
- U.S. Department of Education — College Scorecard
- O*NET Online (Bureau of Labor Statistics)
- National Center for Education Statistics
More about our data sources and methodologies.
Course Advisor provides higher-education, college and university, degree, program, career, salary, and other helpful information to students, faculty, institutions, and other internet audiences. Presented information and data are subject to change. Inclusion on this website does not imply or represent a direct relationship with the company, school, or brand. Information, though believed correct at time of publication, may not be correct, and no warranty is provided. Contact the schools to verify any information before relying on it. Financial aid may be available for those who qualify. The displayed options may include sponsored or recommended results, not necessarily based on your preferences.
© Course Advisor – All Rights Reserved.