Rehabilitation Professions at Rutgers University-New Brunswick
If you are interested in studying Rehabilitation Professions, take a look at what Rutgers University-New Brunswick. Get started with the following essential facts.
Rutgers University-New Brunswick sits in New Brunswick, NJ.
During the most recent reporting year, 173 rehabilitation professions degrees were granted at Rutgers University-New Brunswick.
Featured schools near , edit
Online & Distance Learning at Rutgers University-New Brunswick
Many students take online classes at Rutgers University-New Brunswick. Of 52,269 students, 3,953 (8%) studied exclusively online and 21,737 (42%) took at least some classes online.
Rehabilitation Professions Rankings at Rutgers University-New Brunswick
Rankings can help you compare Rutgers University-New Brunswick’s Rehabilitation Professions program against other schools offering the same major.
Bachelor’s-Level Rankings
| Ranking | Scope | Rank |
|---|---|---|
| Best Schools (Quality) | New Jersey | #1 of 6 |
| Best Value | New Jersey | #4 of 6 |
| Best Schools (Quality) | Middle Atlantic (Region) | #15 of 79 |
| Best Value | Middle Atlantic (Region) | #32 of 76 |
| Best Schools (Quality) | Nationwide | #57 of 394 |
| Best Value | Nationwide | #242 of 370 |
Master’s-Level Rankings
| Ranking | Scope | Rank |
|---|---|---|
| Best Schools (Quality) | New Jersey | #1 of 6 |
| Best Value | New Jersey | #4 of 6 |
| Best Schools (Quality) | Middle Atlantic (Region) | #15 of 79 |
| Best Value | Middle Atlantic (Region) | #32 of 76 |
| Best Schools (Quality) | Nationwide | #57 of 394 |
| Best Value | Nationwide | #242 of 370 |
Doctoral-Level Rankings
| Ranking | Scope | Rank |
|---|---|---|
| Best Schools (Quality) | New Jersey | #1 of 6 |
| Best Value | New Jersey | #4 of 6 |
| Best Schools (Quality) | Middle Atlantic (Region) | #15 of 79 |
| Best Value | Middle Atlantic (Region) | #32 of 76 |
| Best Schools (Quality) | Nationwide | #57 of 394 |
| Best Value | Nationwide | #242 of 370 |
Associate-Level Rankings
| Ranking | Scope | Rank |
|---|---|---|
| Best Schools (Quality) | New Jersey | #1 of 6 |
| Best Value | New Jersey | #4 of 6 |
| Best Schools (Quality) | Middle Atlantic (Region) | #15 of 79 |
| Best Value | Middle Atlantic (Region) | #32 of 76 |
| Best Schools (Quality) | Nationwide | #57 of 394 |
| Best Value | Nationwide | #242 of 370 |
Earnings for Rehabilitation Professions Graduates from Rutgers University-New Brunswick
Graduates of Rutgers University-New Brunswick’s Rehabilitation Professions program earn the following amounts (per the U.S. Department of Education’s College Scorecard):

| Years After Graduation | Median Earnings |
|---|---|
| 1 year | $67,889 |
| 2 years | $70,684 |
| 3 years | $73,519 |
| 4 years | $76,707 |
| 5 years | $82,643 |
How does this compare to the school overall? Four years out, Rehabilitation Professions graduates from Rutgers University-New Brunswick report median earnings of $76,707, compared with $78,171 for all Rutgers University-New Brunswick graduates — about 2% lower than the school-wide median.

Student Demographics & Diversity
Take a look at the diversity of Rehabilitation Professions graduates at Rutgers University-New Brunswick, broken down by degree level.
Across all degree levels, Rehabilitation Professions graduates at Rutgers University-New Brunswick are 72% women (125) and 28% men (48).
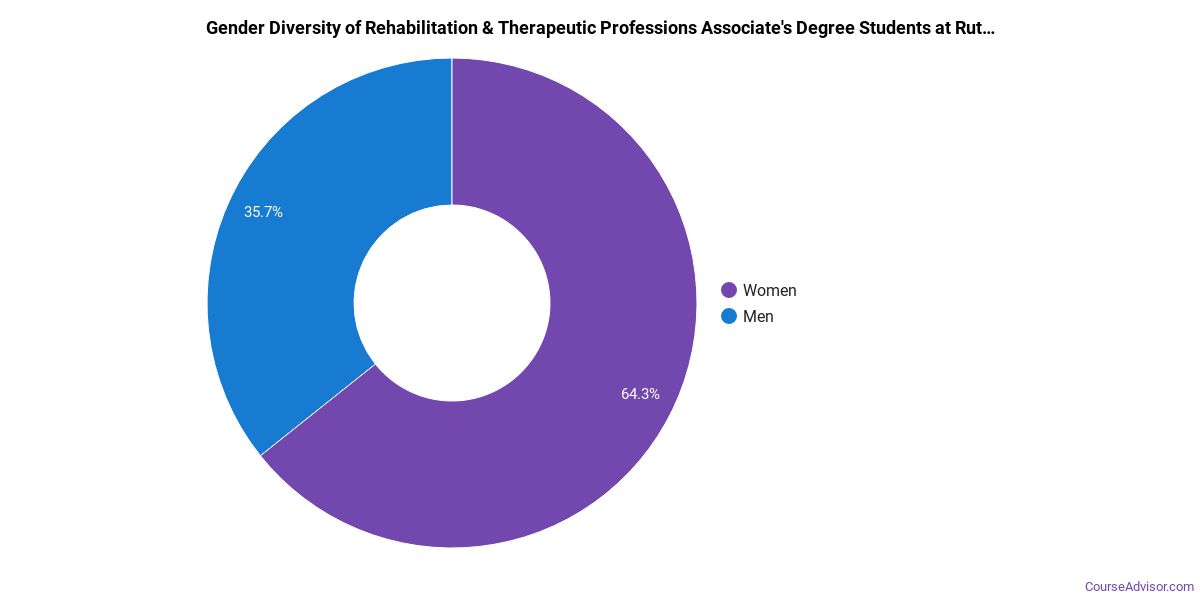
Rehabilitation Professions Associate’s Program at Rutgers University-New Brunswick
Of the 6 associate’s rehabilitation professions graduates at Rutgers University-New Brunswick, 100% were women (6) and 0% were men (0).
The following table and chart show the race/ethnicity of Rehabilitation Professions associate’s degree recipients at Rutgers University-New Brunswick.
| Race / Ethnicity | Number of Graduates |
|---|---|
| White | 1 |
| Hispanic / Latino | 2 |
| Black / African American | 2 |
| Unknown | 1 |
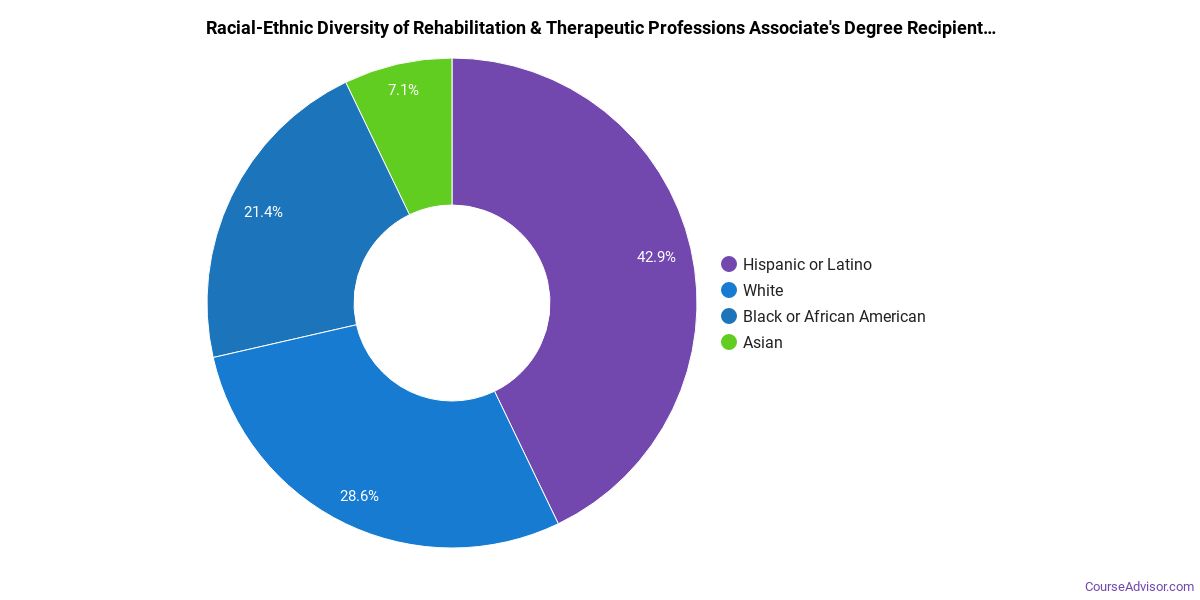
Racial-ethnic minorities make up 67% of Rehabilitation Professions associate’s degree recipients at Rutgers University-New Brunswick, above the national average of 46%.*
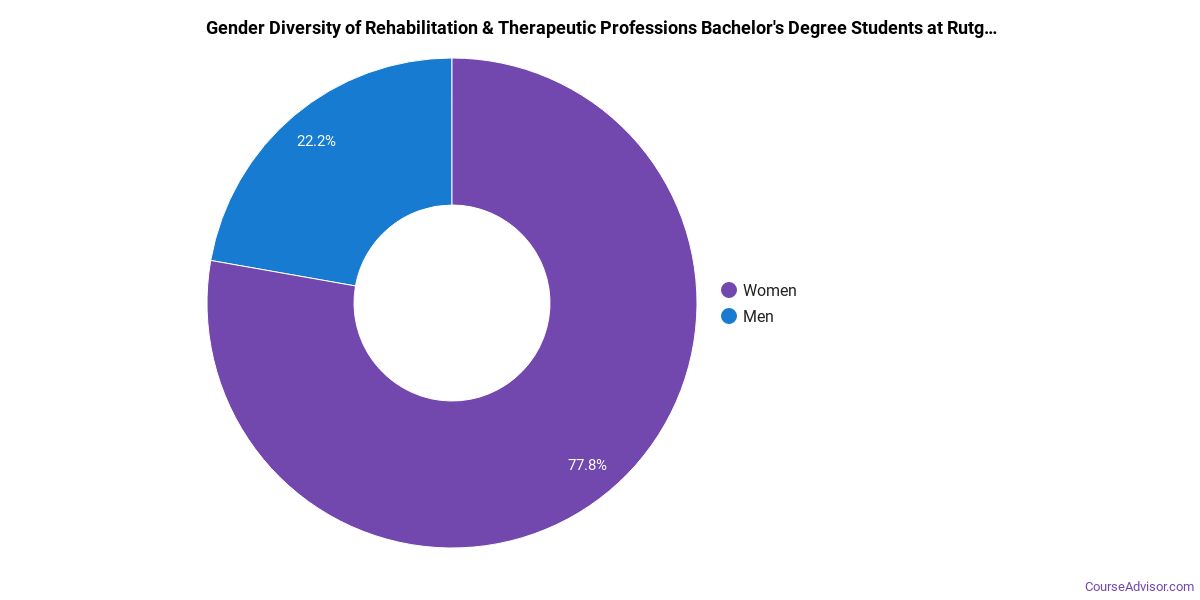
Rehabilitation Professions Bachelor’s Program at Rutgers University-New Brunswick
Among the 16 bachelor’s rehabilitation professions graduates at Rutgers University-New Brunswick, 88% were women (14) and 12% were men (2).
The following table and chart show the race/ethnicity of Rehabilitation Professions bachelor’s degree recipients at Rutgers University-New Brunswick.
| Race / Ethnicity | Number of Graduates |
|---|---|
| White | 4 |
| Hispanic / Latino | 8 |
| Black / African American | 2 |
| Asian | 2 |
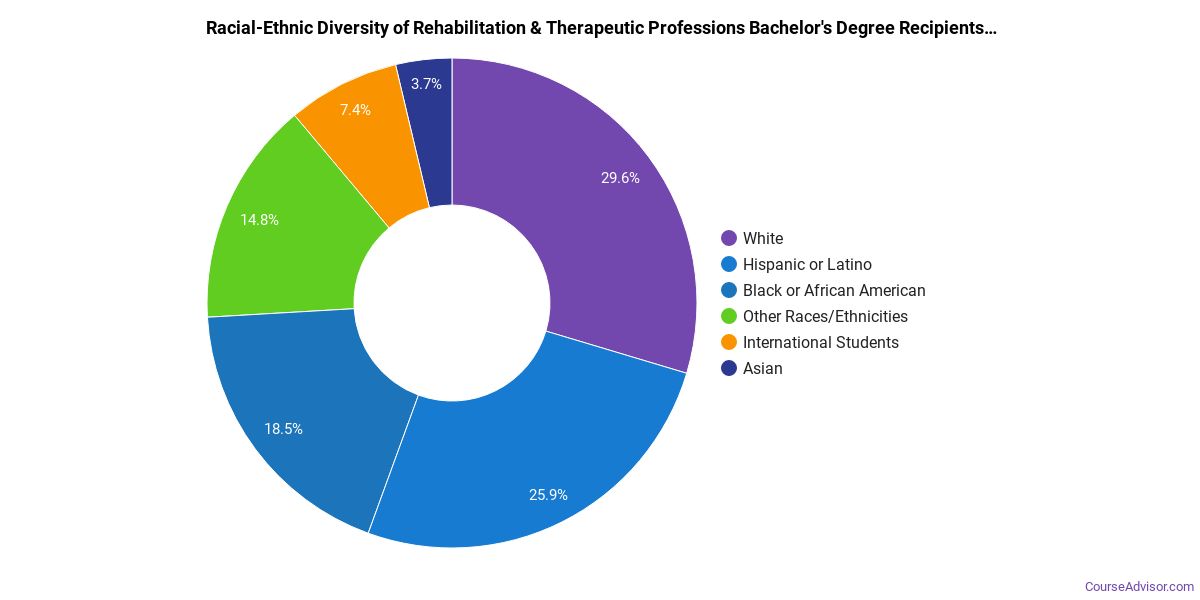
Racial-ethnic minorities make up 75% of Rehabilitation Professions bachelor’s degree recipients at Rutgers University-New Brunswick, higher than the national average of 34%.*
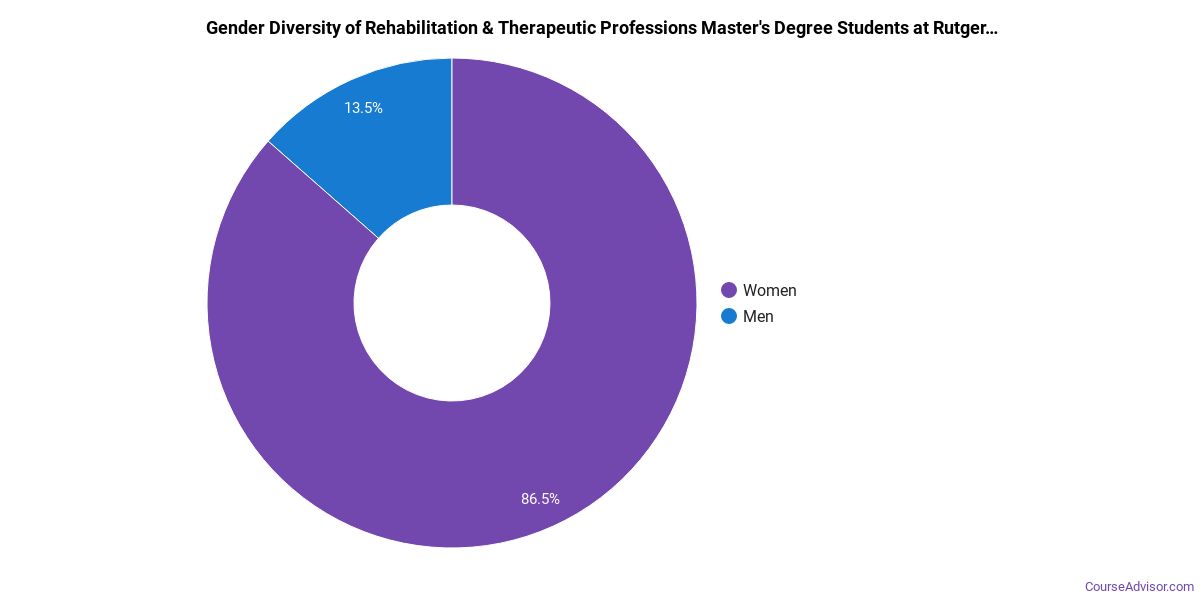
Rehabilitation Professions Master’s Program at Rutgers University-New Brunswick
Of the 37 master’s rehabilitation professions degrees awarded at Rutgers University-New Brunswick, 84% were women (31) and 16% were men (6).
The following table and chart show the race/ethnicity of Rehabilitation Professions master’s degree recipients at Rutgers University-New Brunswick.
| Race / Ethnicity | Number of Graduates |
|---|---|
| White | 25 |
| Hispanic / Latino | 7 |
| Black / African American | 1 |
| Asian | 3 |
| Unknown | 1 |
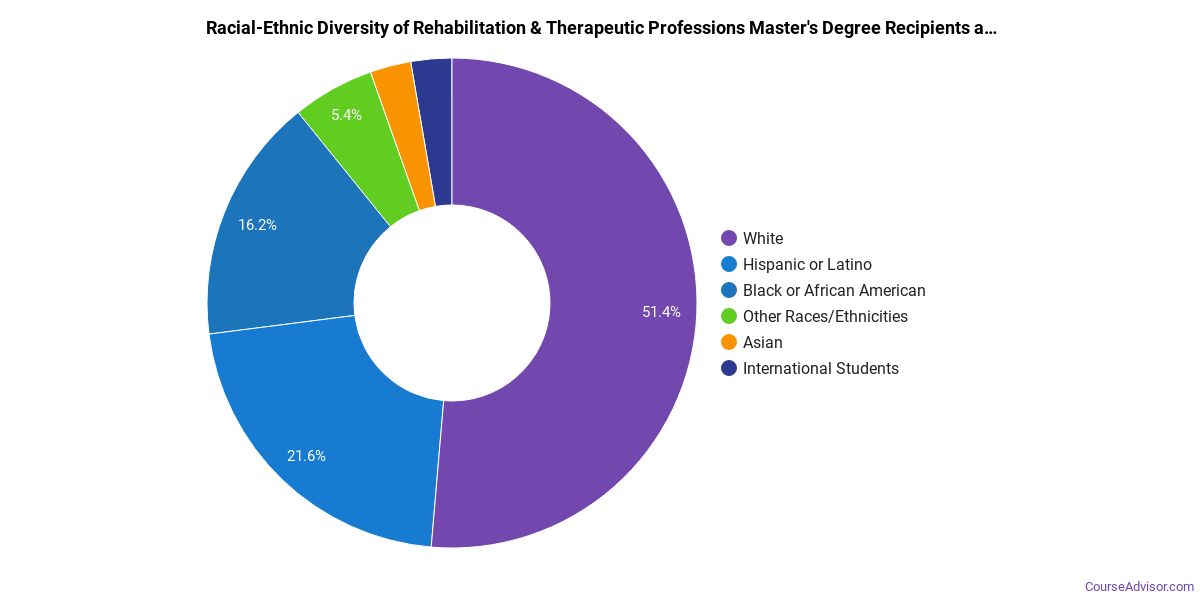
Minority students account for 30% of Rehabilitation Professions master’s degree recipients at Rutgers University-New Brunswick, above the national average of 28%.*
Rehabilitation Professions Doctoral Program at Rutgers University-New Brunswick
Among the 114 doctoral rehabilitation professions graduates at Rutgers University-New Brunswick, 65% were women (74) and 35% were men (40).

The following table and chart show the race/ethnicity of Rehabilitation Professions doctoral degree recipients at Rutgers University-New Brunswick.
| Race / Ethnicity | Number of Graduates |
|---|---|
| White | 51 |
| Hispanic / Latino | 22 |
| Asian | 3 |
| Two or More Races | 36 |
| International (Nonresident) | 1 |
| Unknown | 1 |

Racial-ethnic minorities make up 54% of Rehabilitation Professions doctoral degree recipients at Rutgers University-New Brunswick, higher than the national average of 33%.*
*The racial-ethnic minorities figure is the total number of graduates minus White, international (nonresident), and unknown-race graduates.
More Specific Rehabilitation Professions Concentrations at Rutgers University-New Brunswick
This Rehabilitation Professions program at Rutgers University-New Brunswick includes the following sub-specializations:
| Concentration | Graduates |
|---|---|
| Occupational Therapy | 22 |
| Physical Therapy | 88 |
| Other Rehabilitation Professions | 63 |
Best-Paid Careers for Rehabilitation Professions Graduates
Those who complete Rehabilitation Professions program at Rutgers University-New Brunswick pursue many career paths. Here are the highest-paying careers for Rehabilitation Professions majors, ordered by median annual salary:
| Occupation | Nationwide Median Wage |
|---|---|
| Recreational Therapists | $150,116 |
| Exercise Physiologists | $144,072 |
| Physical Therapists | $144,047 |
| Engineers, All Other | $136,628 |
| Low Vision Therapists, Orientation and Mobility Specialists, and Vision Rehabilitation Therapists | $124,839 |
| Therapists, All Other | $121,750 |
| Solar Energy Systems Engineers | $116,775 |
| Mechatronics Engineers | $115,569 |
| Microsystems Engineers | $104,558 |
| Wind Energy Engineers | $98,460 |
References
- IPEDS — Integrated Postsecondary Education Data System
- U.S. Department of Education — College Scorecard
- O*NET Online (Bureau of Labor Statistics)
- National Center for Education Statistics
More about our data sources and methodologies.
Course Advisor provides higher-education, college and university, degree, program, career, salary, and other helpful information to students, faculty, institutions, and other internet audiences. Presented information and data are subject to change. Inclusion on this website does not imply or represent a direct relationship with the company, school, or brand. Information, though believed correct at time of publication, may not be correct, and no warranty is provided. Contact the schools to verify any information before relying on it. Financial aid may be available for those who qualify. The displayed options may include sponsored or recommended results, not necessarily based on your preferences.
© Course Advisor – All Rights Reserved.