Public Administration at Montana State University
What traits are you looking for in a school for Public Administration, consider the program at Montana State University. Get started with the following essential facts.
Montana State University is located in Bozeman, MT.
During the most recent reporting year, 8 public administration graduations were recorded at Montana State University.
Featured schools near , edit
Online & Distance Learning at Montana State University
Many students take online classes at Montana State University. Among 17,135 students, 909 (5%) studied exclusively online and 2,540 (15%) took at least some classes online.
Student Demographics & Diversity
Take a look at the composition of Public Administration graduates at Montana State University, broken down by degree level.
Across all degree levels, Public Administration graduates at Montana State University are 75% women (6) and 25% men (2).
Public Administration Master’s Program at Montana State University
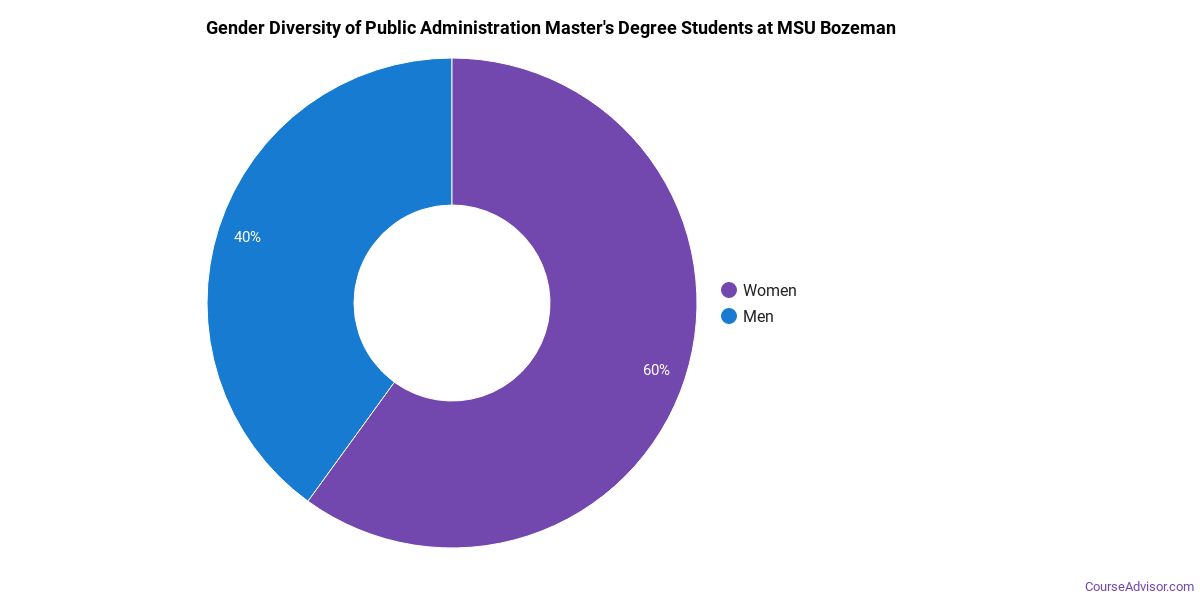
Of the 8 master’s public administration graduates at Montana State University, 75% were women (6) and 25% were men (2).
The following table and chart show the race/ethnicity of Public Administration master’s degree recipients at Montana State University.
| Race / Ethnicity | Number of Graduates |
|---|---|
| White | 7 |
| Hispanic / Latino | 1 |
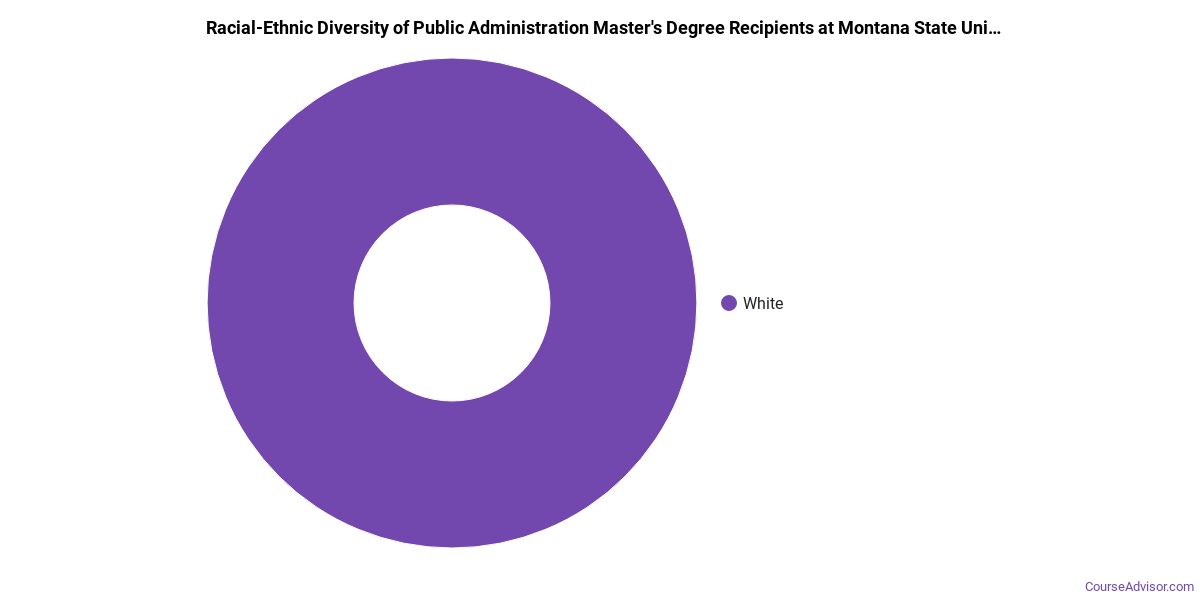
Racial-ethnic minorities make up 12% of Public Administration master’s degree recipients at Montana State University, lower than the national average of 40%.*
*The racial-ethnic minorities figure is the total number of graduates minus White, international (nonresident), and unknown-race graduates.
More Specific Public Administration Concentrations at Montana State University
The Public Administration program at Montana State University offers more specialized concentrations:
| Concentration | Graduates |
|---|---|
| Public Administration | 8 |
Top-Paying Careers for Public Administration Graduates
Students who finish Public Administration program at Montana State University pursue many career paths. The table below ranks the top-paying careers for Public Administration majors, ordered by median annual salary:
| Occupation | Nationwide Median Wage |
|---|---|
| Wind Energy Development Managers | $169,952 |
| Legislators | $167,600 |
| Loss Prevention Managers | $165,723 |
| Social and Community Service Managers | $156,089 |
| General and Operations Managers | $149,694 |
| Chief Executives | $138,534 |
| Supply Chain Managers | $138,103 |
| Wind Energy Operations Managers | $122,567 |
| Compliance Managers | $117,178 |
| Brownfield Redevelopment Specialists and Site Managers | $99,321 |
References
- IPEDS — Integrated Postsecondary Education Data System
- U.S. Department of Education — College Scorecard
- O*NET Online (Bureau of Labor Statistics)
- National Center for Education Statistics
More about our data sources and methodologies.
Course Advisor provides higher-education, college and university, degree, program, career, salary, and other helpful information to students, faculty, institutions, and other internet audiences. Presented information and data are subject to change. Inclusion on this website does not imply or represent a direct relationship with the company, school, or brand. Information, though believed correct at time of publication, may not be correct, and no warranty is provided. Contact the schools to verify any information before relying on it. Financial aid may be available for those who qualify. The displayed options may include sponsored or recommended results, not necessarily based on your preferences.
© Course Advisor – All Rights Reserved.