General Visual & Performing Arts at Champlain College
If you are interested in studying General Visual & Performing Arts, consider the program at Champlain College. The following information will help you decide if it is a good fit for you.
Champlain College is located in Burlington, VT.
In the most recent year for which we have data, 41 general visual & performing arts degrees were awarded at Champlain College.
Featured schools near , edit
Online & Distance Learning at Champlain College
Many students take online classes at Champlain College. Among 3,259 students, 1,570 (48%) studied exclusively online and 259 (8%) took at least some classes online.
General Visual & Performing Arts Rankings at Champlain College
Use these rankings to compare Champlain College’s General Visual & Performing Arts program against other schools offering the same major.
Bachelor’s-Level Rankings
| Ranking | Scope | Rank |
|---|---|---|
| Best Schools (Quality) | Vermont | #1 of 2 |
| Best Value | Vermont | #2 of 2 |
| Best Schools (Quality) | New England (Region) | #3 of 7 |
| Best Value | New England (Region) | #7 of 7 |
| Best Schools (Quality) | Nationwide | #43 of 156 |
| Best Value | Nationwide | #147 of 155 |
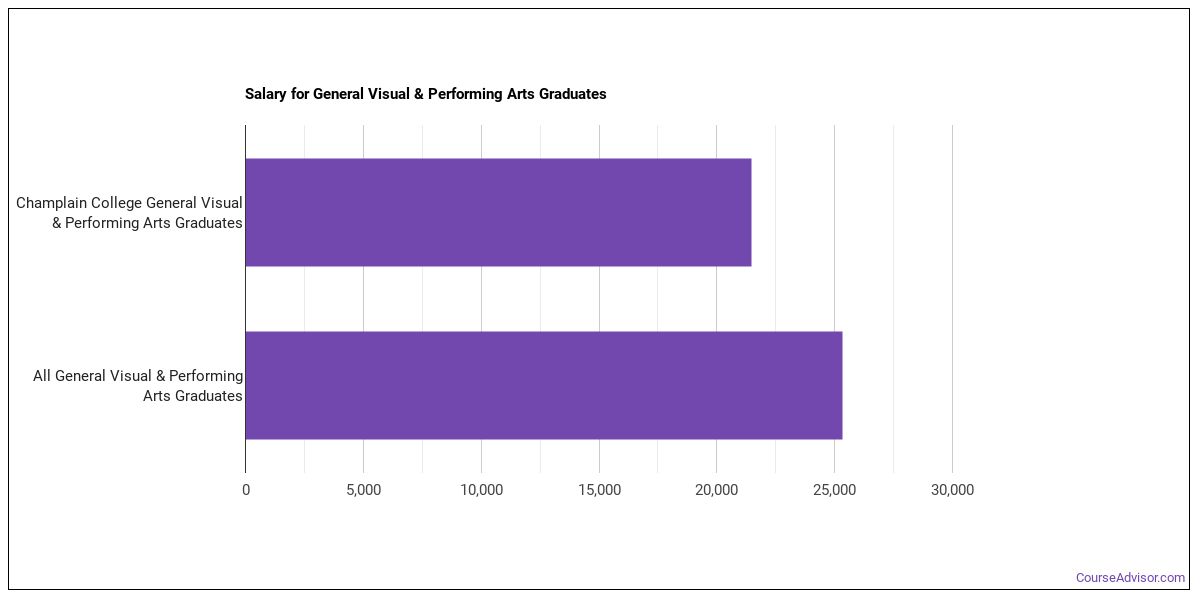
Earnings for General Visual & Performing Arts Graduates from Champlain College
Those who finish Champlain College’s General Visual & Performing Arts program report the following median earnings (per the U.S. Department of Education’s College Scorecard):
| Years After Graduation | Median Earnings |
|---|---|
| 1 year | $21,457 |
| 2 years | $25,774 |
| 3 years | $30,946 |
| 4 years | $38,725 |
| 5 years | $44,607 |
Is this above or below average for the school? Four years out, General Visual & Performing Arts graduates from Champlain College take home a median $38,725, compared with $65,633 for all Champlain College graduates — about 41% lower than the school-wide median.

Median Debt at Graduation
Typical debt at graduation for General Visual & Performing Arts graduates from Champlain College is $27,000.
Student Demographics & Diversity
Take a look at the diversity of General Visual & Performing Arts graduates at Champlain College, by degree type.
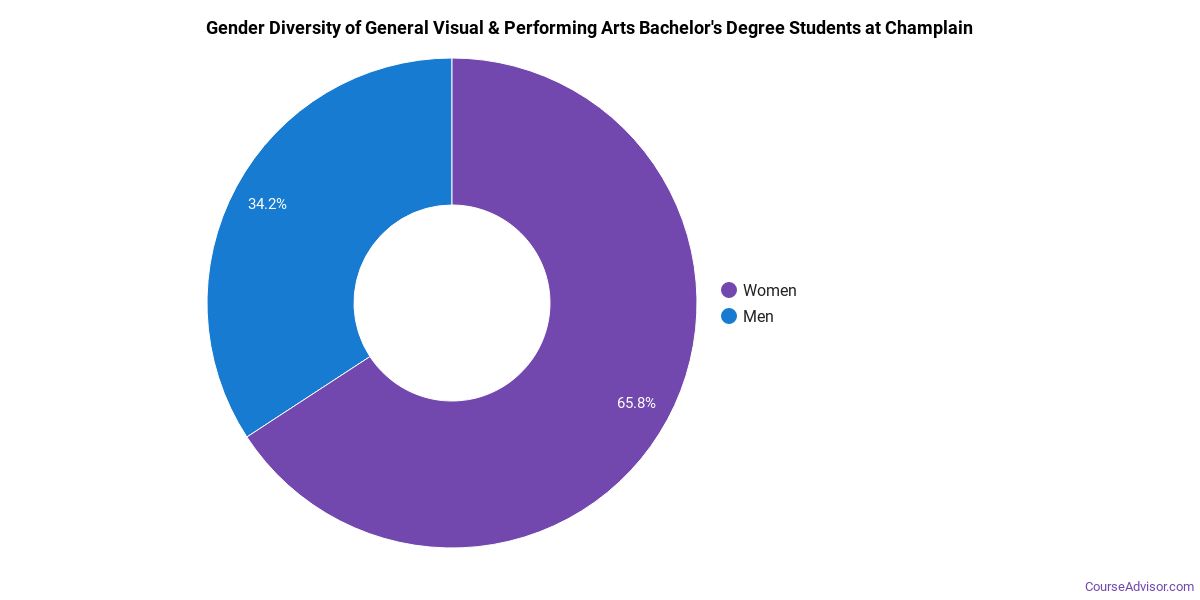
Program-wide, General Visual & Performing Arts graduates at Champlain College are 63% women (26) and 37% men (15).
General Visual & Performing Arts Bachelor’s Program at Champlain College
Of the 41 bachelor’s general visual & performing arts graduates at Champlain College, 63% were women (26) and 37% were men (15).
The following table and chart show the race/ethnicity of General Visual & Performing Arts bachelor’s degree recipients at Champlain College.
| Race / Ethnicity | Number of Graduates |
|---|---|
| White | 31 |
| Hispanic / Latino | 3 |
| Black / African American | 3 |
| Asian | 2 |
| Two or More Races | 1 |
| Unknown | 1 |
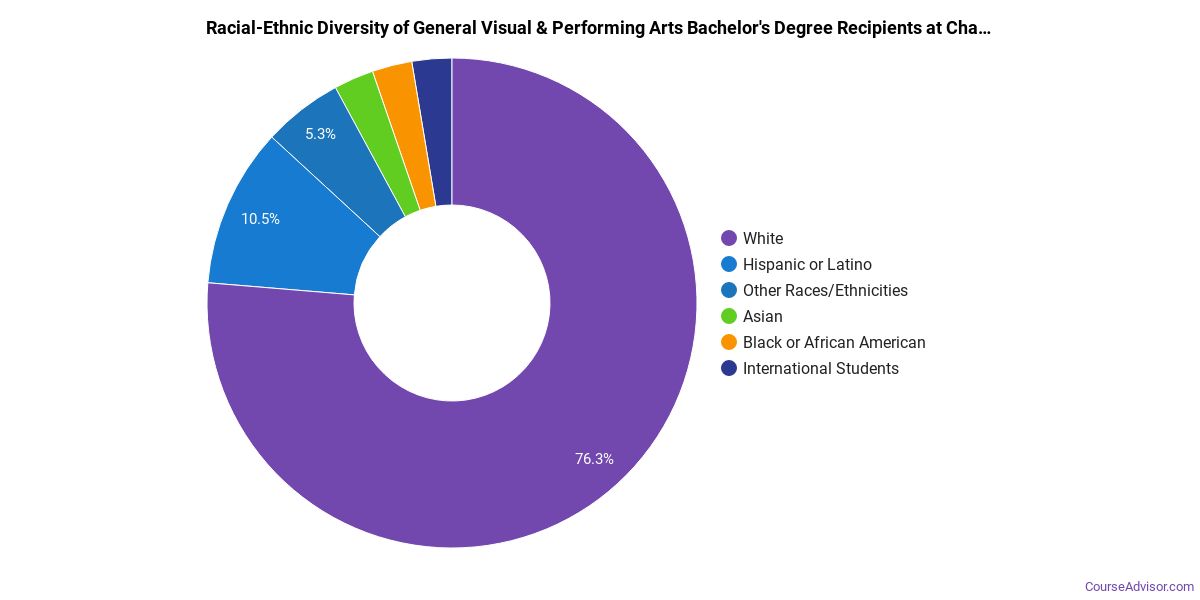
Minority students account for 22% of General Visual & Performing Arts bachelor’s degree recipients at Champlain College, below the national average of 45%.*
*The racial-ethnic minorities figure is the total number of graduates minus White, international (nonresident), and unknown-race graduates.
More Specific General Visual & Performing Arts Concentrations at Champlain College
The General Visual & Performing Arts program at Champlain College breaks down into more specific concentrations:
| Concentration | Graduates |
|---|---|
| Visual & Performing Arts | 15 |
| Digital Arts | 26 |
Highest-Paying Careers for General Visual & Performing Arts Graduates
Graduates of the General Visual & Performing Arts program at Champlain College work across a variety of fields. Below are the top-paying careers for General Visual & Performing Arts majors, ordered by median annual salary:
| Occupation | Nationwide Median Wage |
|---|---|
| Art Directors | $103,285 |
| Artists and Related Workers, All Other | $83,610 |
| Craft Artists | $76,826 |
| Photographers | $75,743 |
| Fine Artists, Including Painters, Sculptors, and Illustrators | $69,338 |
| Graphic Designers | $66,386 |
| Special Effects Artists and Animators | $57,836 |
| Art, Drama, and Music Teachers, Postsecondary | $46,983 |
References
- IPEDS — Integrated Postsecondary Education Data System
- U.S. Department of Education — College Scorecard
- O*NET Online (Bureau of Labor Statistics)
- National Center for Education Statistics
More about our data sources and methodologies.
Course Advisor provides higher-education, college and university, degree, program, career, salary, and other helpful information to students, faculty, institutions, and other internet audiences. Presented information and data are subject to change. Inclusion on this website does not imply or represent a direct relationship with the company, school, or brand. Information, though believed correct at time of publication, may not be correct, and no warranty is provided. Contact the schools to verify any information before relying on it. Financial aid may be available for those who qualify. The displayed options may include sponsored or recommended results, not necessarily based on your preferences.
© Course Advisor – All Rights Reserved.