Entrepreneurial Studies at Central Michigan University
What traits are you looking for in a school for Entrepreneurial Studies, you may want to check out the program at Central Michigan University. The following information will help you decide if it is a good fit for you.
Central Michigan University is in Mount Pleasant, MI.
During the most recent reporting year, 54 entrepreneurial studies degrees were awarded at Central Michigan University.
Featured schools near , edit
Studying Online at Central Michigan University
Distance learning is available at Central Michigan University. Among 14,488 students, 3,356 (23%) studied exclusively online and 5,044 (35%) took at least some classes online.
Entrepreneurial Studies Rankings at Central Michigan University
Rankings can help you compare Central Michigan University’s Entrepreneurial Studies program to other colleges that offer this major.
Bachelor’s-Level Rankings
| Ranking | Scope | Rank |
|---|---|---|
| Best Schools (Quality) | Michigan | #4 of 11 |
| Best Value | Michigan | #6 of 11 |
| Best Schools (Quality) | Great Lakes (Region) | #25 of 44 |
| Best Value | Great Lakes (Region) | #32 of 44 |
| Best Schools (Quality) | Nationwide | #128 of 251 |
| Best Value | Nationwide | #162 of 251 |
Master’s-Level Rankings
| Ranking | Scope | Rank |
|---|---|---|
| Best Schools (Quality) | Michigan | #4 of 11 |
| Best Value | Michigan | #6 of 11 |
| Best Schools (Quality) | Great Lakes (Region) | #25 of 44 |
| Best Value | Great Lakes (Region) | #32 of 44 |
| Best Schools (Quality) | Nationwide | #128 of 251 |
| Best Value | Nationwide | #162 of 251 |
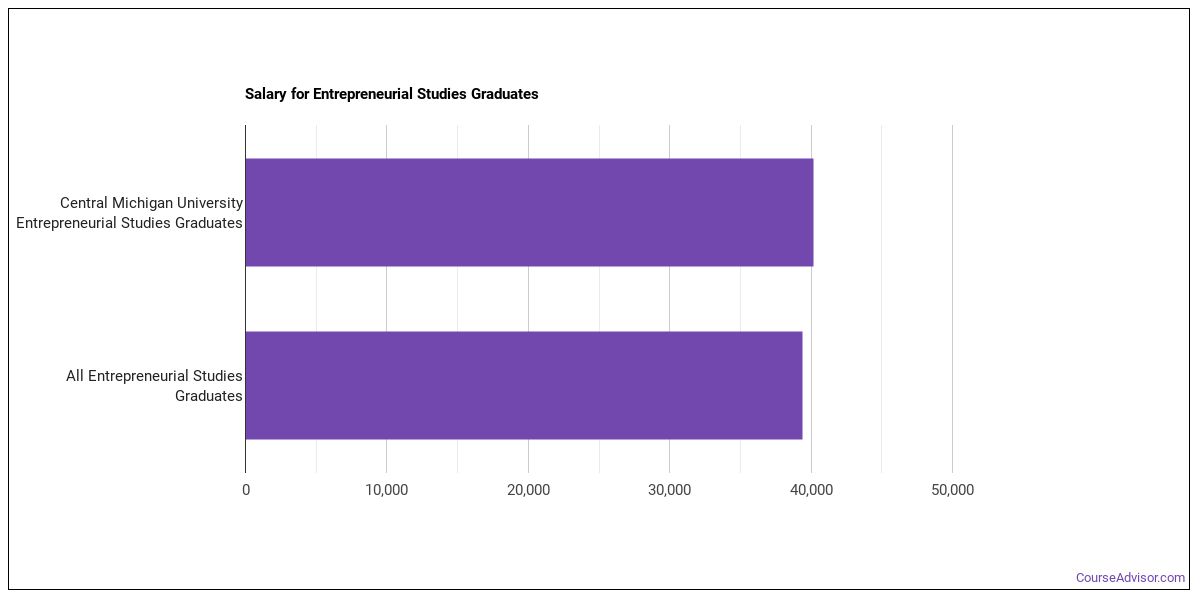
Earnings for Entrepreneurial Studies Graduates from Central Michigan University
Students who complete Central Michigan University’s Entrepreneurial Studies program earn the following amounts (per the U.S. Department of Education’s College Scorecard):
| Years After Graduation | Median Earnings |
|---|---|
| 1 year | $40,200 |
| 2 years | $39,214 |
| 3 years | $46,645 |
| 4 years | $53,574 |
| 5 years | $53,580 |
Is this above or below average for the school? Four years out, Entrepreneurial Studies graduates from Central Michigan University report median earnings of $53,574, compared with $61,603 for all Central Michigan University graduates — about 13% lower than the school-wide median.

Median Debt at Graduation
Median student loan debt for Entrepreneurial Studies graduates from Central Michigan University is $27,000.
Student Demographics & Diversity
Take a look at the composition of Entrepreneurial Studies graduates at Central Michigan University, by degree type.
Across all degree levels, Entrepreneurial Studies graduates at Central Michigan University are 30% women (16) and 70% men (38).
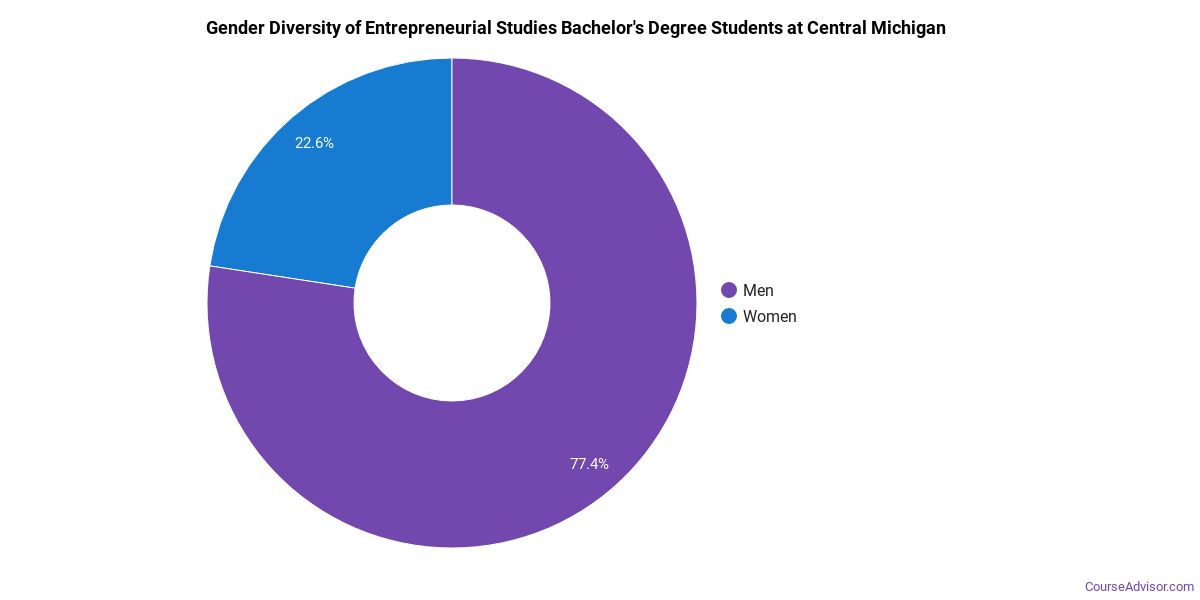
Entrepreneurial Studies Bachelor’s Program at Central Michigan University
Among the 49 bachelor’s entrepreneurial studies degrees awarded at Central Michigan University, 31% were women (15) and 69% were men (34).
The following table and chart show the race/ethnicity of Entrepreneurial Studies bachelor’s degree recipients at Central Michigan University.
| Race / Ethnicity | Number of Graduates |
|---|---|
| White | 35 |
| Hispanic / Latino | 4 |
| Black / African American | 7 |
| Two or More Races | 1 |
| International (Nonresident) | 1 |
| Unknown | 1 |
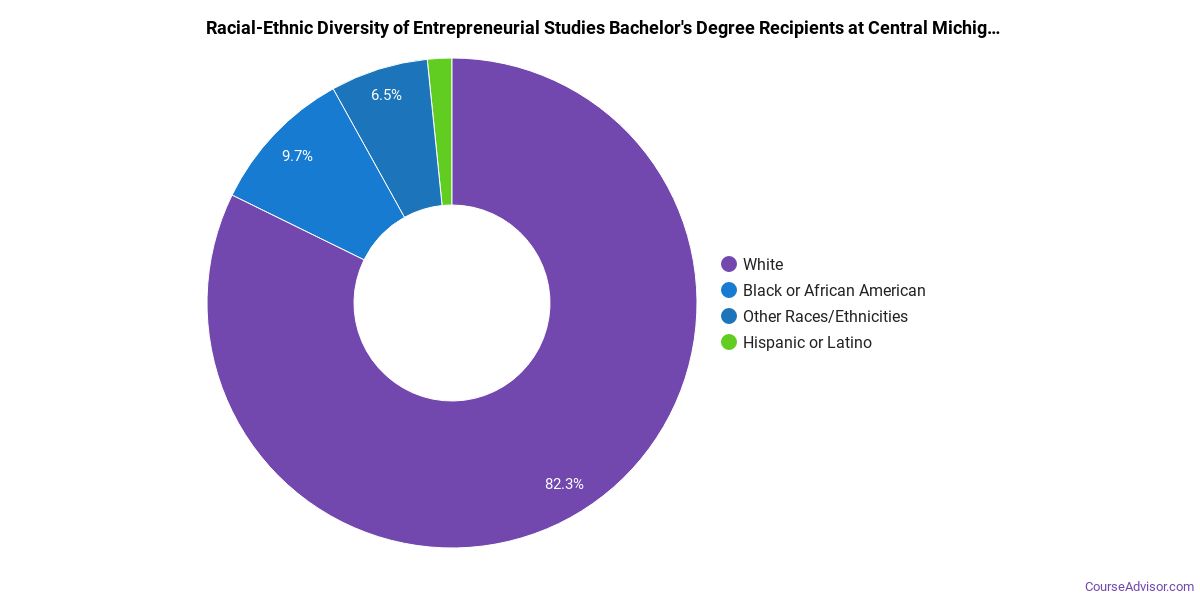
Racial-ethnic minorities make up 24% of Entrepreneurial Studies bachelor’s degree recipients at Central Michigan University, lower than the national average of 34%.*
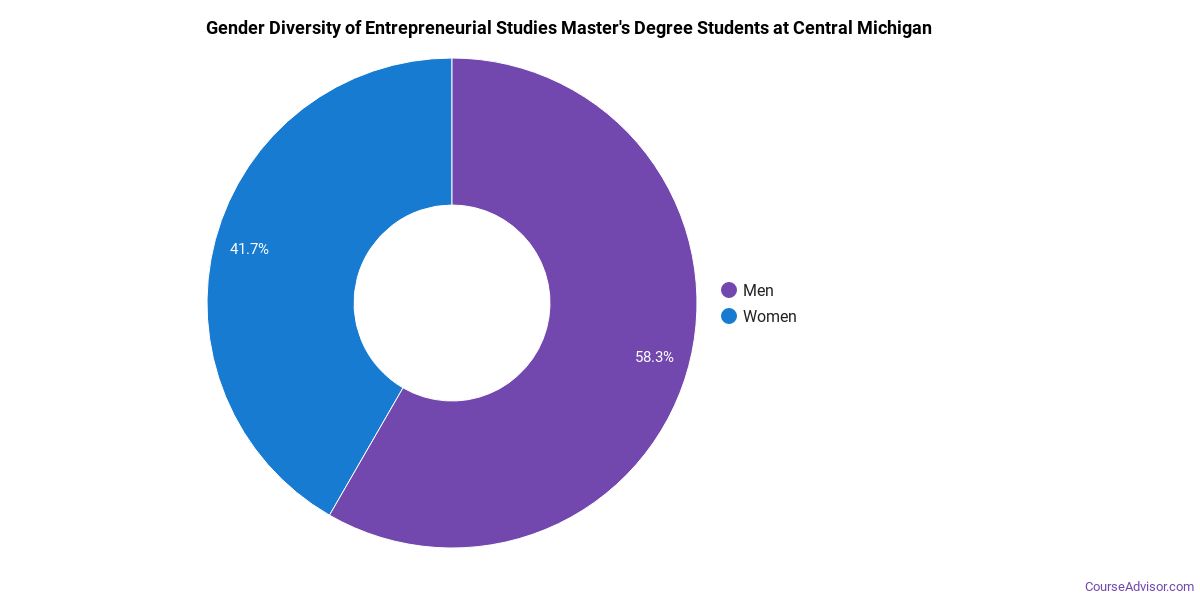
Entrepreneurial Studies Master’s Program at Central Michigan University
Among the 5 master’s entrepreneurial studies graduates at Central Michigan University, 20% were women (1) and 80% were men (4).
The following table and chart show the race/ethnicity of Entrepreneurial Studies master’s degree recipients at Central Michigan University.
| Race / Ethnicity | Number of Graduates |
|---|---|
| White | 1 |
| Hispanic / Latino | 1 |
| Black / African American | 2 |
| Unknown | 1 |
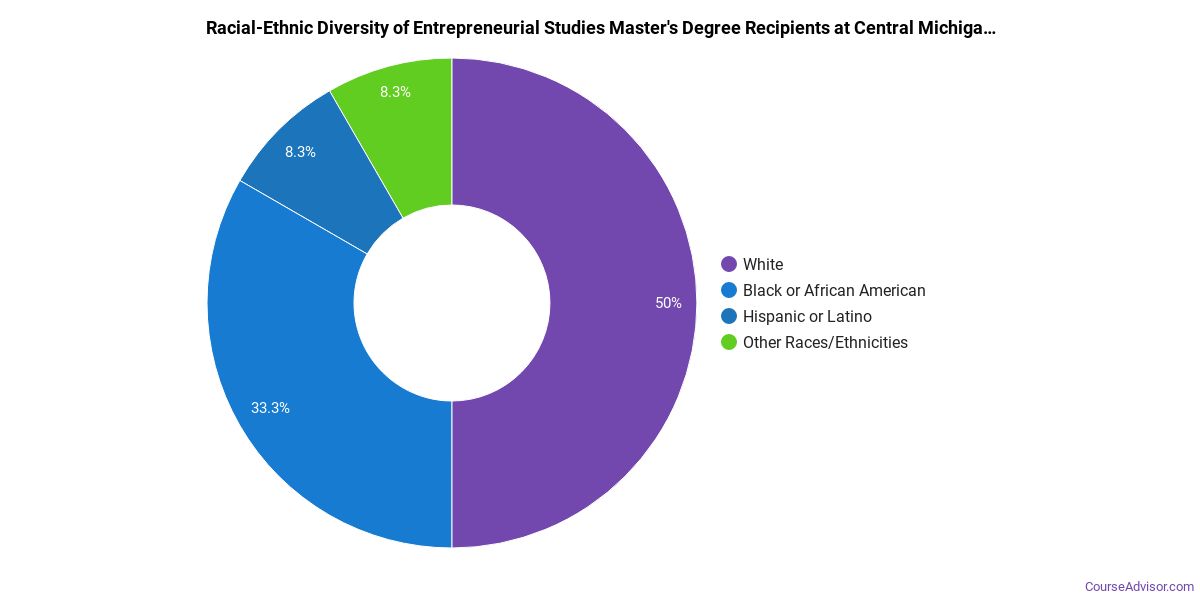
Minority students account for 60% of Entrepreneurial Studies master’s degree recipients at Central Michigan University, higher than the national average of 37%.*
*The racial-ethnic minorities figure is the total number of graduates minus White, international (nonresident), and unknown-race graduates.
More Specific Entrepreneurial Studies Concentrations at Central Michigan University
This Entrepreneurial Studies program at Central Michigan University breaks down into more specific concentrations:
| Concentration | Graduates |
|---|---|
| Entrepreneurship | 54 |
Highest-Paying Careers for Entrepreneurial Studies Graduates
Graduates of the Entrepreneurial Studies program at Central Michigan University go on to a range of careers. Below are the top-paying careers for Entrepreneurial Studies majors, ordered by median annual salary:
| Occupation | Nationwide Median Wage |
|---|---|
| Personal Service Managers, All Other | $176,674 |
| Wind Energy Development Managers | $169,952 |
| Loss Prevention Managers | $165,723 |
| General and Operations Managers | $149,694 |
| Spa Managers | $143,396 |
| Chief Executives | $138,534 |
| Wind Energy Operations Managers | $122,567 |
| Compliance Managers | $117,178 |
| Brownfield Redevelopment Specialists and Site Managers | $99,321 |
| Chief Sustainability Officers | $96,628 |
References
- IPEDS — Integrated Postsecondary Education Data System
- U.S. Department of Education — College Scorecard
- O*NET Online (Bureau of Labor Statistics)
- National Center for Education Statistics
More about our data sources and methodologies.
Course Advisor provides higher-education, college and university, degree, program, career, salary, and other helpful information to students, faculty, institutions, and other internet audiences. Presented information and data are subject to change. Inclusion on this website does not imply or represent a direct relationship with the company, school, or brand. Information, though believed correct at time of publication, may not be correct, and no warranty is provided. Contact the schools to verify any information before relying on it. Financial aid may be available for those who qualify. The displayed options may include sponsored or recommended results, not necessarily based on your preferences.
© Course Advisor – All Rights Reserved.