Management Sciences & Methods at Belmont University
What traits are you looking for in a school for Management Sciences & Methods, you may want to check out the program at Belmont University. The following information will help you decide if it is a good fit for you.
Belmont University is in Nashville, TN.
For the most recent IPEDS reporting year, 4 management sciences & methods graduations were recorded at Belmont University.
Featured schools near , edit
Studying Online at Belmont University
Many students take online classes at Belmont University. Among 8,803 students, 141 (2%) were enrolled entirely in distance education and 3,322 (38%) took at least some classes online.
Management Sciences & Methods Rankings at Belmont University
Use these rankings to compare Belmont University’s Management Sciences & Methods program to other colleges that offer this major.
Student Demographics & Diversity
Below you’ll find the composition of Management Sciences & Methods graduates at Belmont University, by degree type.
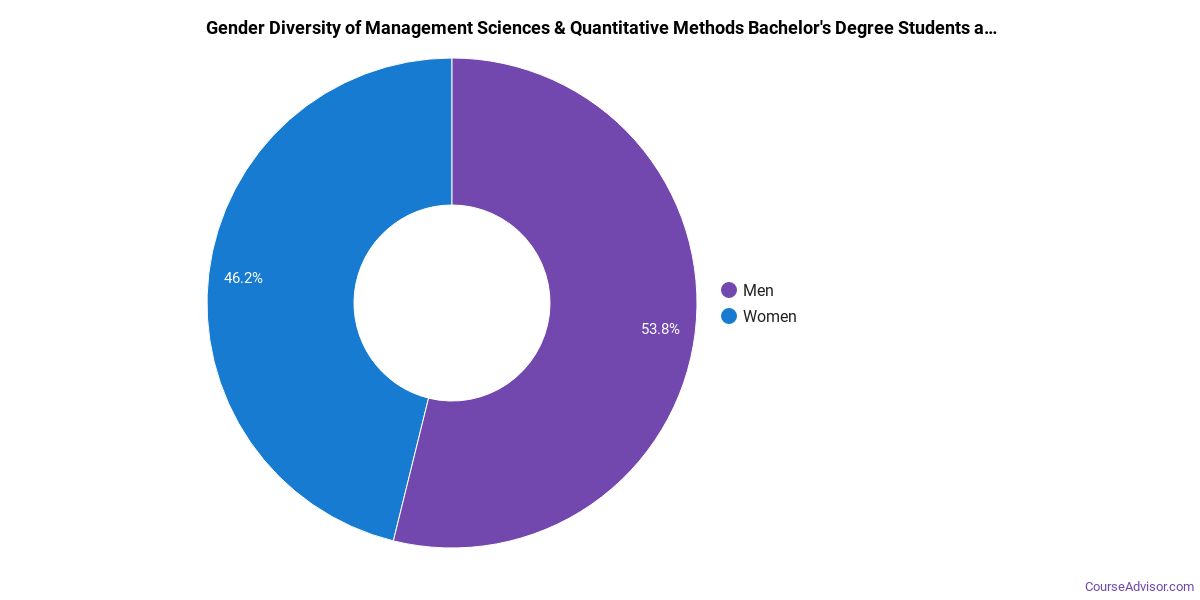
Program-wide, Management Sciences & Methods graduates at Belmont University are 50% women (2) and 50% men (2).
Management Sciences & Methods Bachelor’s Program at Belmont University
Of the 4 bachelor’s management sciences & methods graduates at Belmont University, 50% were women (2) and 50% were men (2).
The following table and chart show the race/ethnicity of Management Sciences & Methods bachelor’s degree recipients at Belmont University.
| Race / Ethnicity | Number of Graduates |
|---|---|
| White | 3 |
| Asian | 1 |
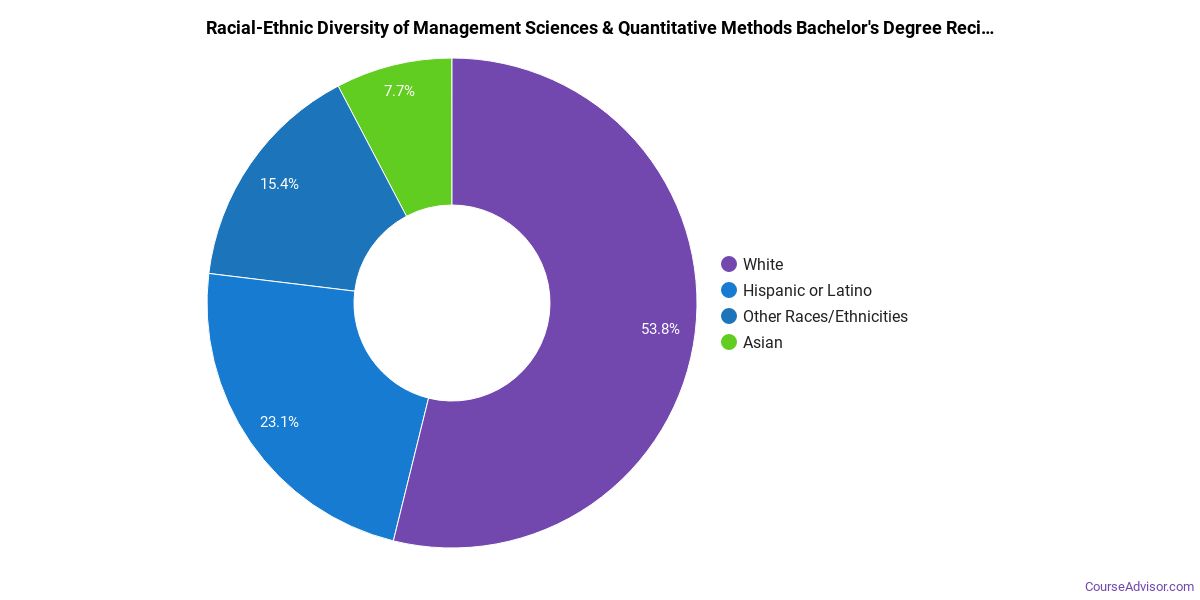
Minority students account for 25% of Management Sciences & Methods bachelor’s degree recipients at Belmont University, lower than the national average of 38%.*
*The racial-ethnic minorities figure is the total number of graduates minus White, international (nonresident), and unknown-race graduates.
More Specific Management Sciences & Methods Concentrations at Belmont University
The Management Sciences & Methods program at Belmont University breaks down into more specific concentrations:
| Concentration | Graduates |
|---|---|
| Management Science | 4 |
Highest-Paying Careers for Management Sciences & Methods Graduates
Students who finish Management Sciences & Methods program at Belmont University go on to a range of careers. The table below ranks the highest-paying careers for Management Sciences & Methods majors, ordered by median annual salary:
| Occupation | Nationwide Median Wage |
|---|---|
| General and Operations Managers | $149,694 |
| Business Intelligence Analysts | $143,840 |
| Chief Executives | $138,534 |
| Statisticians | $130,349 |
| Insurance Underwriters | $129,939 |
| Financial Risk Specialists | $127,364 |
| Biostatisticians | $121,594 |
| Survey Researchers | $108,538 |
| Data Scientists | $106,295 |
| Clinical Data Managers | $99,475 |
References
- IPEDS — Integrated Postsecondary Education Data System
- U.S. Department of Education — College Scorecard
- O*NET Online (Bureau of Labor Statistics)
- National Center for Education Statistics
More about our data sources and methodologies.
Course Advisor provides higher-education, college and university, degree, program, career, salary, and other helpful information to students, faculty, institutions, and other internet audiences. Presented information and data are subject to change. Inclusion on this website does not imply or represent a direct relationship with the company, school, or brand. Information, though believed correct at time of publication, may not be correct, and no warranty is provided. Contact the schools to verify any information before relying on it. Financial aid may be available for those who qualify. The displayed options may include sponsored or recommended results, not necessarily based on your preferences.
© Course Advisor – All Rights Reserved.