Insurance Claims and Policy Processing Clerks in California
Thinking about a career as an Insurance Claims and Policy Processing Clerks in California? Here’s what you need to know. Process new insurance policies, modifications to existing policies, and claims forms. Obtain information from policyholders to verify the accuracy and completeness of information on claims forms, applications and related documents, and company records. Update existing policies and company records to reflect changes requested by policyholders and insurance company representatives. Excludes “Claims Adjusters, Examiners, and Investigators” (13-1031).
What do Insurance Claims and Policy Processing Clerks Make in California?
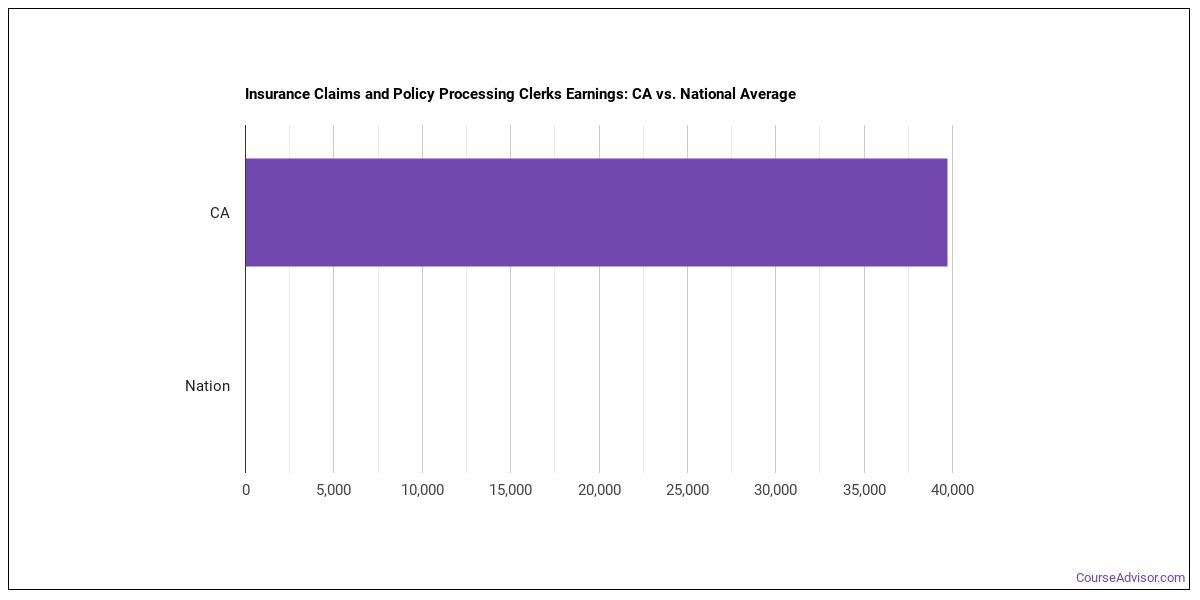
For insurance claims and policy processing clerks working in California, the median annual wage is $54,120 per year (or roughly $26.02/hour).Earnings range from $38,920 at the 10th percentile to $77,310 at the 90th percentile.
| Wage Statistic | Annual | Hourly |
|---|---|---|
| 10th percentile | $38,920 | $18.71 |
| 25th percentile | $46,500 | $22.36 |
| Median (50th) | $54,120 | $26.02 |
| 75th percentile | $62,780 | $30.18 |
| 90th percentile | $77,310 | $37.17 |

The location quotient — a measure of how concentrated this occupation is in California compared to the national average — is 0.95.
National Wage Comparison
Nationally, insurance claims and policy processing clerks earn a median of $34,431 per year ($16.55/hour), exceeding the California median.
Employment Outlook
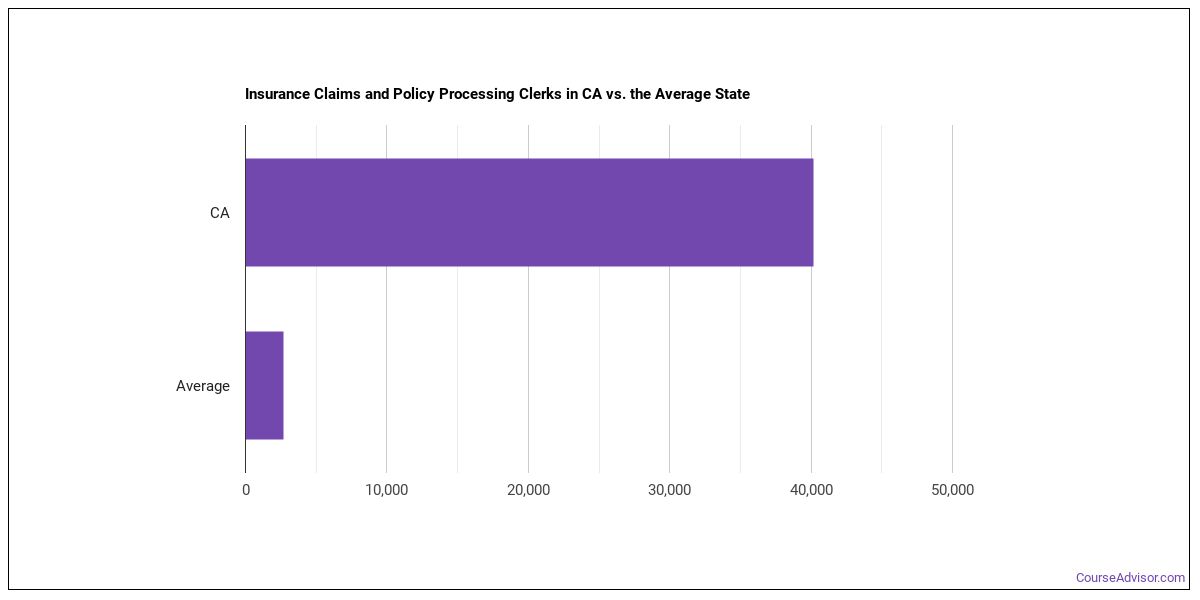
Nationally, total employment in this occupation is 939,223 insurance claims and policy processing clerks across the United States. In California alone, approximately 25,360 people work in this role. That’s more than the typical state, which employs around 2,290 insurance claims and policy processing clerks.

Top California Metros for Insurance Claims and Policy Processing Clerks
The metro areas below employ the most insurance claims and policy processing clerks in California.
| Metro Area | Number Employed | Annual Median Salary |
|---|---|---|
| Los Angeles-Long Beach-Anaheim, CA | 7,940 | $49,410 |
| San Diego-Chula Vista-Carlsbad, CA | 2,950 | $49,920 |
| San Francisco-Oakland-Fremont, CA | 2,740 | $60,550 |
| Sacramento-Roseville-Folsom, CA | 2,180 | $51,850 |
| Riverside-San Bernardino-Ontario, CA | 1,500 | $49,530 |
| Fresno, CA | 660 | $47,380 |
| Oxnard-Thousand Oaks-Ventura, CA | 400 | $53,110 |
| Stockton-Lodi, CA | 370 | $50,020 |
| Santa Rosa-Petaluma, CA | 250 | $60,440 |
| Bakersfield-Delano, CA | 230 | $48,570 |
| Redding, CA | 230 | $52,330 |
| Modesto, CA | 210 | $49,490 |
| Vallejo, CA | 190 | $55,740 |
| Santa Maria-Santa Barbara, CA | 170 | $48,970 |
| Chico, CA | 120 | $46,970 |
| Santa Cruz-Watsonville, CA | 120 | $59,840 |
| Visalia, CA | 110 | $47,920 |
| Merced, CA | 80 | $53,030 |
| San Luis Obispo-Paso Robles, CA | 70 | $46,440 |
| Salinas, CA | 60 | $59,610 |
| Napa, CA | 30 | $50,820 |
Top States for Insurance Claims and Policy Processing Clerks Employment
View the states that employ the most insurance claims and policy processing clerks work.
| State | Number Employed |
|---|---|
| Texas | 28,160 |
| California | 25,360 |
| Florida | 17,010 |
| Ohio | 11,680 |
| Georgia | 10,040 |
| Illinois | 9,160 |
| Tennessee | 8,810 |
| Arizona | 8,240 |
| New York | 7,480 |
| North Carolina | 7,110 |
| Pennsylvania | 6,640 |
| Indiana | 5,830 |
| Michigan | 5,820 |
| Massachusetts | 5,020 |
| Virginia | 4,890 |
| New Jersey | 4,780 |
| Missouri | 4,780 |
| Wisconsin | 4,670 |
| South Carolina | 4,120 |
| Minnesota | 4,030 |
Highest-Paying States for Insurance Claims and Policy Processing Clerks
These states pay the most for insurance claims and policy processing clerks.
| State | Annual Median Salary |
|---|---|
| Washington | $59,190 |
| New Jersey | $58,010 |
| New Hampshire | $57,830 |
| New York | $57,620 |
| District of Columbia | $57,510 |
| Connecticut | $56,950 |
| Massachusetts | $56,400 |
| Colorado | $55,030 |
| California | $54,120 |
| Minnesota | $53,570 |
Skills
Key insurance claims and policy processing clerks skills, rated on an importance scale of 0 to 5:
Knowledge Areas
Key knowledge areas for this occupation, rated on an importance scale of 0 to 5:
Abilities
Top abilities for insurance claims and policy processing clerks, rated on an importance scale of 0 to 5:
Daily Tasks
Insurance Claims and Policy Processing Clerks typically:
- Prepare insurance claim forms or related documents, and review them for completeness.
- Calculate amount of claim.
- Post or attach information to claim file.
- Transmit claims for payment or further investigation.
- Contact insured or other involved persons to obtain missing information.
- Review insurance policy to determine coverage.
- Process and record new insurance policies and claims.
- Organize or work with detailed office or warehouse records, using computers to enter, access, search or retrieve data.
- Provide customer service, such as limited instructions on proceeding with claims or referrals to auto repair facilities or local contractors.
- Correspond with insured or agent to obtain information or to inform them of account status or changes.
- Review and verify data, such as age, name, address, and principal sum and value of property, on insurance applications and policies.
- Compare information from application to criteria for policy reinstatement, and approve reinstatement when criteria are met.
Work Activities
- Working with Computers
- Getting Information
- Processing Information
- Communicating with Supervisors, Peers, or Subordinates
- Documenting/Recording Information
- Evaluating Information to Determine Compliance with Standards
- Communicating with People Outside the Organization
- Establishing and Maintaining Interpersonal Relationships
- Making Decisions and Solving Problems
- Updating and Using Relevant Knowledge
- Performing Administrative Activities
- Organizing, Planning, and Prioritizing Work
Tools & Technology
Technologies frequently used: Hot technologies: Microsoft Access In-demand technologies: Microsoft Excel
What Major Will Prepare You For This Career?
Related college programs include:
- Business Support & Assistance
Featured schools near , edit
Related Careers
Related occupations to insurance claims and policy processing clerks include:
- Claims Adjusters, Examiners, and Investigators
- Compensation, Benefits, and Job Analysis Specialists
- Insurance Underwriters
- Tax Examiners and Collectors, and Revenue Agents
- Title Examiners, Abstractors, and Searchers
- Medical Records Specialists
Also Known As
Agency Service Representative (Agency Service Rep), Auto Claims Rep (Automotive Claims Representative), Auto Liability Claims Rep (Automotive Liability Claims Representative), Billing and Insurance Coordinator, Bodily Injury Claims Representative (Bodily Injury Claims Rep), Cancellation Clerk, Claim Representative (Claims Rep), Claims Adjudicator, Claims Analyst, Claims Assistant, Claims Associate, Claims Clerk, Claims Coordinator, Claims Customer Service Representative (Claims CSR), Claims Processing Specialist (CPS).
References
- U.S. Bureau of Labor Statistics, Occupational Employment and Wage Statistics — https://www.bls.gov/oes/
- O*NET Online — https://www.onetonline.org/
- BLS Employment Projections — https://www.bls.gov/emp/
- O*NET-SOC code: 43-9041.00
Course Advisor provides higher-education, college and university, degree, program, career, salary, and other helpful information to students, faculty, institutions, and other internet audiences. Presented information and data are subject to change. Inclusion on this website does not imply or represent a direct relationship with the company, school, or brand. Information, though believed correct at time of publication, may not be correct, and no warranty is provided. Contact the schools to verify any information before relying on it. Financial aid may be available for those who qualify. The displayed options may include sponsored or recommended results, not necessarily based on your preferences.
© Course Advisor – All Rights Reserved.