Health Technologists and Technicians, All Other in Washington
Thinking about a career as a Health Technologists and Technicians, All Other in Washington? Here’s what you need to know. All health technologists and technicians not listed separately.
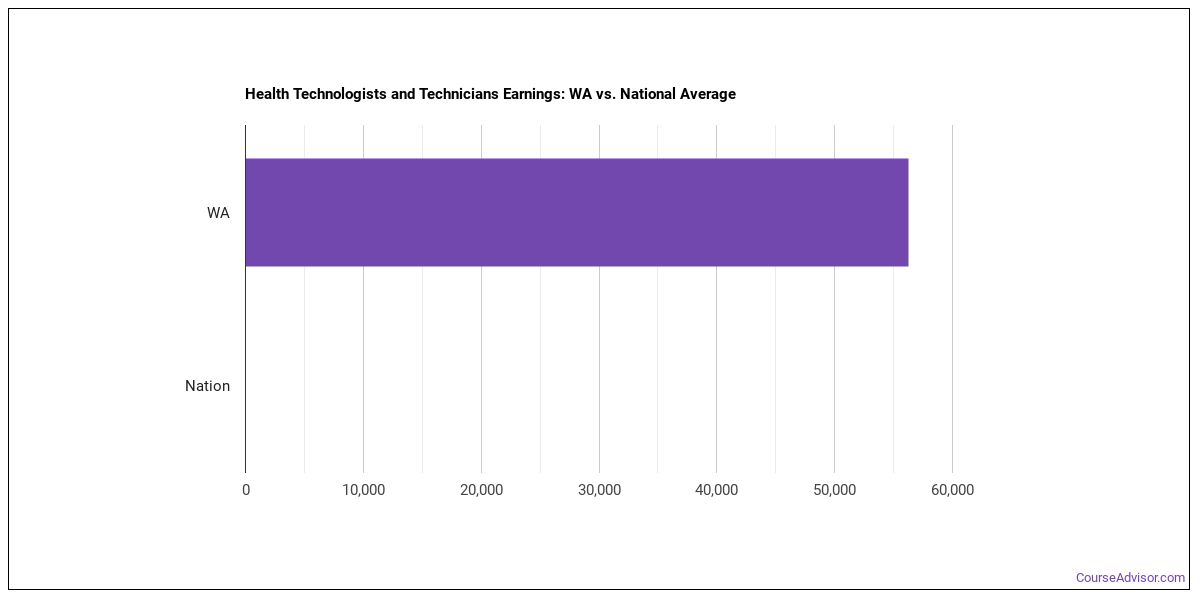
What do Health Technologists and Technicians, All Other Make in Washington?
For a health technologists and technicians, all other working in Washington, the median annual wage is $59,960 per year (or about $28.83/hour).Annual wages span from $45,310 at the 10th percentile to $104,250 at the 90th percentile.
| Wage Statistic | Annual | Hourly |
|---|---|---|
| 10th percentile | $45,310 | $21.79 |
| 25th percentile | $48,970 | $23.55 |
| Median (50th) | $59,960 | $28.83 |
| 75th percentile | $79,550 | $38.24 |
| 90th percentile | $104,250 | $50.12 |

Location quotient — how concentrated this career is in Washington relative to the national average — is 0.90.
National Wage Comparison
Nationally, health technologists and technicians, all other earn a median of $153,940 per year ($74.01/hour), lower than the Washington median.
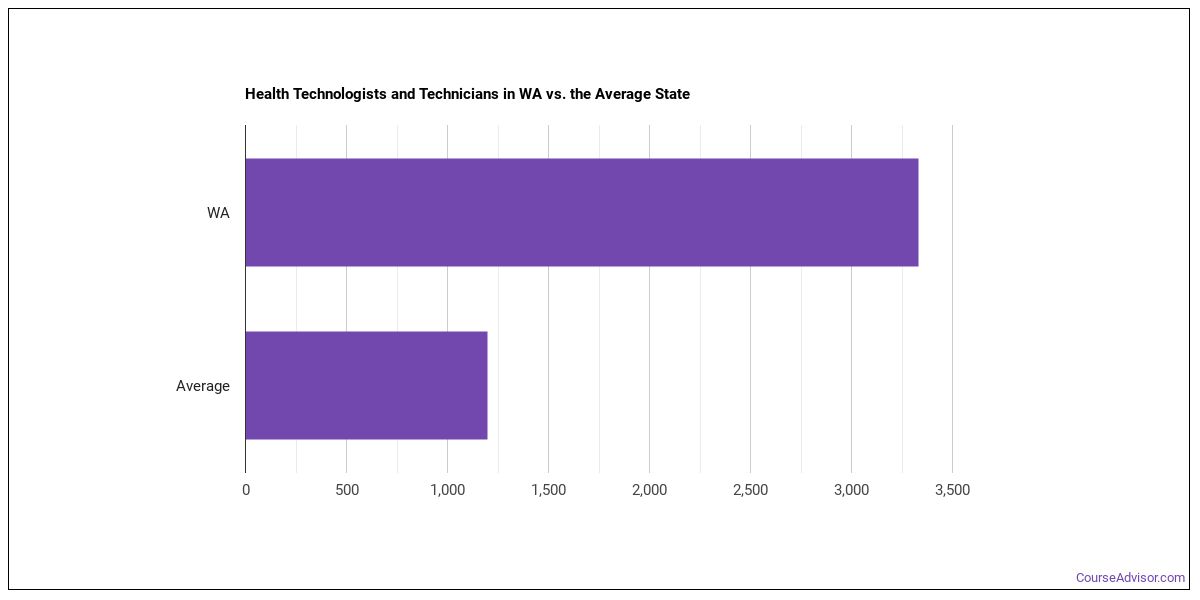
Employment Outlook
Nationally, total employment in this occupation is 2,858,460 health technologists and technicians, all other nationwide. In Washington alone, around 3,600 people work in this role. That puts the state above the typical state, which employs around 1,980 health technologists and technicians, all other.

Top Washington Metros for Health Technologists and Technicians, All Other
These are the Washington metros with the most health technologists and technicians, all other in Washington.
| Metro Area | Number Employed | Annual Median Salary |
|---|---|---|
| Seattle-Tacoma-Bellevue, WA | 1,930 | $59,970 |
| Kennewick-Richland, WA | 390 | n/a |
| Spokane-Spokane Valley, WA | 260 | $55,720 |
| Yakima, WA | 120 | $46,190 |
| Olympia-Lacey-Tumwater, WA | 100 | $53,090 |
| Bellingham, WA | 90 | $69,340 |
| Wenatchee-East Wenatchee, WA | 90 | $53,480 |
| Bremerton-Silverdale-Port Orchard, WA | 50 | $55,910 |
| Longview-Kelso, WA | 40 | $60,060 |
| Mount Vernon-Anacortes, WA | 30 | $61,090 |
Top States for Health Technologists and Technicians, All Other Employment
These states have the highest employment of health technologists and technicians, all other work.
| State | Number Employed |
|---|---|
| California | 24,540 |
| Texas | 15,220 |
| Florida | 10,660 |
| Pennsylvania | 9,970 |
| New York | 8,660 |
| Ohio | 8,420 |
| North Carolina | 6,860 |
| New Jersey | 5,650 |
| Missouri | 5,560 |
| Michigan | 5,500 |
| Georgia | 5,280 |
| Illinois | 5,150 |
| Massachusetts | 4,420 |
| Wisconsin | 4,410 |
| South Carolina | 4,230 |
| Virginia | 3,750 |
| Washington | 3,600 |
| Louisiana | 3,330 |
| Arizona | 2,670 |
| Indiana | 2,640 |
Highest-Paying States for Health Technologists and Technicians, All Other
The highest-paying states for health technologists and technicians, all other.
| State | Annual Median Salary |
|---|---|
| Wyoming | $65,560 |
| Delaware | $64,860 |
| Washington | $59,960 |
| Kansas | $59,780 |
| Maine | $58,820 |
| California | $58,310 |
| Oregon | $58,240 |
| Massachusetts | $58,210 |
| New York | $57,690 |
| Hawaii | $56,260 |
What Major Will Prepare You For This Career?
Programs that train for this career include:
- Allied Health Professions
- Allied Health Services
- Clinical/Medical Laboratory Science
Featured schools near , edit
Also Known As
Audiometrist, Brain Wave Technician, Central Supply Technician, Cephalometric Analyst, Certified Medical Technician (CMT), Certified Respiratory Therapy Technician (CRTT), Child Health Associate, Closed Circuit Screen Watcher, Dialysis Patient Care Technician, Dialysis Technician, Drug Coordinator, EEG Technician (Electroencephalographic Technician), EEG Technologist (Electroencephalographic Technologist), Electroencephalogram (EEG) Technologist, Electroencephalograph Technician.
References
- U.S. Bureau of Labor Statistics, Occupational Employment and Wage Statistics — https://www.bls.gov/oes/
- O*NET Online — https://www.onetonline.org/
- BLS Employment Projections — https://www.bls.gov/emp/
- O*NET-SOC code: 29-2099.00
Course Advisor provides higher-education, college and university, degree, program, career, salary, and other helpful information to students, faculty, institutions, and other internet audiences. Presented information and data are subject to change. Inclusion on this website does not imply or represent a direct relationship with the company, school, or brand. Information, though believed correct at time of publication, may not be correct, and no warranty is provided. Contact the schools to verify any information before relying on it. Financial aid may be available for those who qualify. The displayed options may include sponsored or recommended results, not necessarily based on your preferences.
© Course Advisor – All Rights Reserved.