Food Servers, Nonrestaurant: Career Overview
Serve food to individuals outside of a restaurant environment, such as in hotel rooms, hospital rooms, residential care facilities, or cars.
Featured schools near , edit
The Daily Work of Food Servers, Nonrestaurant Do?
Typical responsibilities of food servers, nonrestaurant cover:
- Place food servings on plates or trays according to orders or instructions.
- Clean or sterilize dishes, kitchen utensils, equipment, or facilities.
- Monitor food distribution, ensuring that meals are delivered to the correct recipients and that guidelines, such as those for special diets, are followed.
- Examine trays to ensure that they contain required items.
- Load trays with accessories, such as eating utensils, napkins, or condiments.
- Take food orders and relay orders to kitchens or serving counters so they can be filled.
- Monitor food preparation or serving techniques to ensure that proper procedures are followed.
- Remove trays and stack dishes for return to kitchen after meals are finished.
Key Skills and Knowledge
Top food servers, nonrestaurant combine a mix of skills and domain knowledge.
Top Skills
The abilities most central to this role, rated on an importance scale of 0 to 5:
Core Knowledge
Types of Food Servers, Nonrestaurant Jobs
Common job titles for this role include:
- Boat Hop
- Car Attendant
- Car Hop
- Curb Attendant
- Curb Hop
- Curber
- Dining Room Server
- Food Cart Attendant
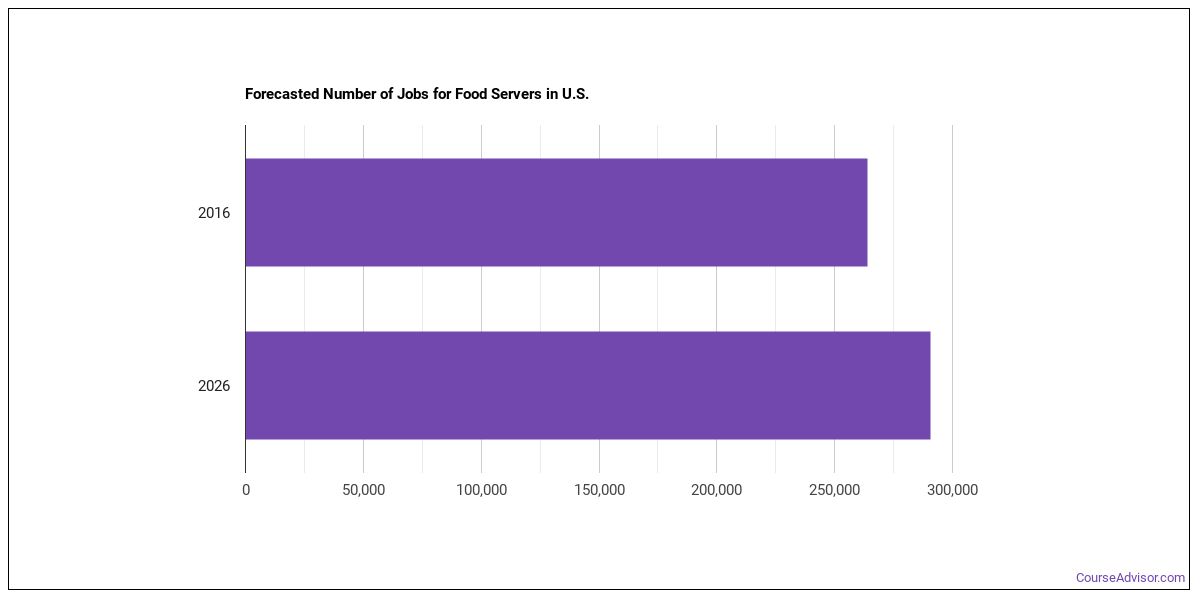
Job Outlook
There are about 239,378 food servers, nonrestaurant working in the United States today. Employment is projected to grow by +10.8% over the projection horizon.
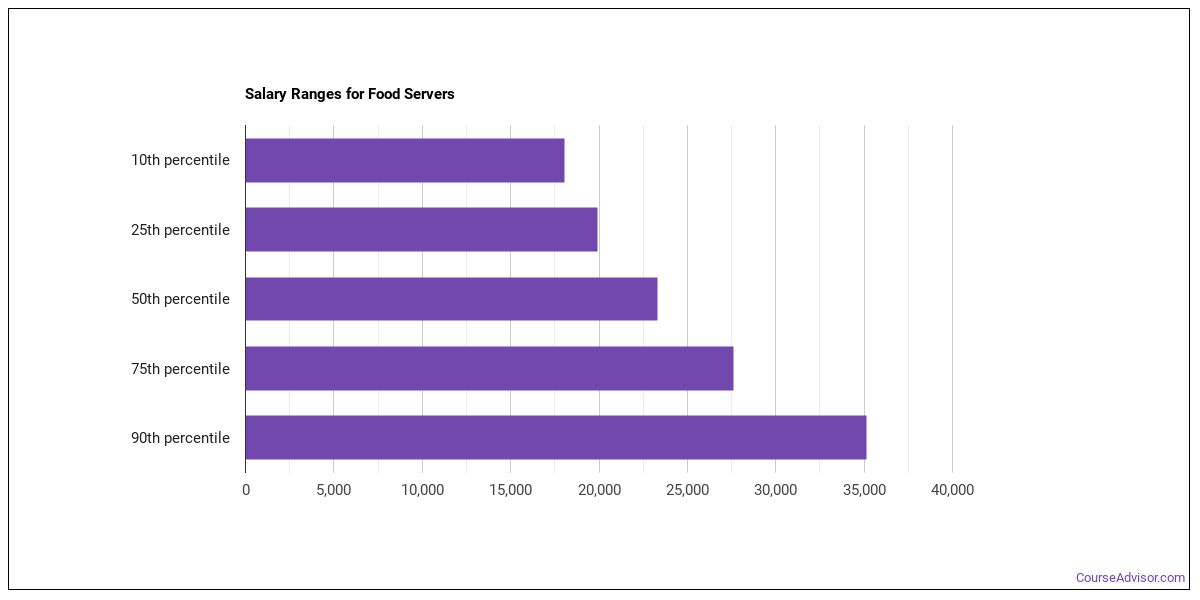
Salary for Food Servers, Nonrestaurant
| Statistic | Value |
|---|---|
| Annual median | $31,218 |
| Hourly median | $15.01 |
| 10th percentile | $21,991 |
| 25th percentile | $26,604 |
| 75th percentile | $35,831 |
| 90th percentile | $40,444 |
Pay can vary substantially based on experience, location, and industry.
How Much Do Food Servers, Nonrestaurant Make in Different U.S. States?
| State | Annual median salary |
|---|---|
| Colorado | $38,180 |
| New York | $38,010 |
| Washington | $37,770 |
| California | $37,690 |
| District of Columbia | $37,570 |
| Hawaii | $37,470 |
| Massachusetts | $36,540 |
| New Hampshire | $36,110 |
| Vermont | $36,040 |
| Oregon | $36,020 |
| Connecticut | $35,780 |
| North Dakota | $35,730 |
| New Jersey | $35,310 |
| Minnesota | $35,300 |
| Maine | $35,270 |
| Arizona | $35,150 |
| Maryland | $35,020 |
| Wisconsin | $34,490 |
| Illinois | $34,380 |
| Virginia | $33,920 |
| Nevada | $33,740 |
| Rhode Island | $33,630 |
| Florida | $32,170 |
| Wyoming | $32,050 |
| Georgia | $31,900 |
| Michigan | $31,720 |
| Delaware | $31,690 |
| Indiana | $31,670 |
| Montana | $31,670 |
| Alaska | $31,490 |
| Idaho | $31,200 |
| Virgin Islands | $31,100 |
| New Mexico | $31,100 |
| Kentucky | $31,080 |
| Missouri | $31,080 |
| Pennsylvania | $31,070 |
| Nebraska | $30,930 |
| South Dakota | $30,920 |
| North Carolina | $30,560 |
| South Carolina | $30,150 |
| Texas | $29,590 |
| West Virginia | $29,480 |
| Ohio | $29,380 |
| Iowa | $29,270 |
| Tennessee | $29,050 |
| Utah | $28,280 |
| Alabama | $27,810 |
| Oklahoma | $27,130 |
| Arkansas | $26,580 |
| Kansas | $26,250 |
| Louisiana | $25,550 |
| Mississippi | $24,580 |
| Puerto Rico | $20,570 |
Pay by U.S. Region
Earnings for food servers, nonrestaurant vary by region. The following regions pay the most:
| Region | Median annual wage | Share of U.S. jobs | Location quotient |
|---|---|---|---|
| Far Western US | $37,337 | 16.0% | 0.97 |
| New England | $36,025 | 5.5% | 1.25 |
| Rocky Mountains | $35,301 | 4.3% | 1.26 |
| Middle Atlantic | $34,589 | 19.0% | 1.33 |
| Plains States | $32,377 | 9.9% | 1.75 |
| Great Lakes | $32,351 | 16.4% | 1.19 |
| Southeast | $30,578 | 20.4% | 0.86 |
| Southwest | $30,410 | 8.2% | 0.65 |
Top Metro Areas
| Metro area | State | Median annual wage | Employment |
|---|---|---|---|
| Kahului-Wailuku, HI | HI | $57,540 | 140 |
| San Francisco-Oakland-Fremont, CA | CA | $44,710 | 4,440 |
| San Jose-Sunnyvale-Santa Clara, CA | CA | $44,200 | 1,890 |
| Ithaca, NY | NY | $40,230 | 100 |
| Burlington-South Burlington, VT | VT | $39,730 | 280 |
| Napa, CA | CA | $39,150 | 160 |
| Denver-Aurora-Centennial, CO | CO | $38,850 | 4,550 |
| Seattle-Tacoma-Bellevue, WA | WA | $38,730 | 4,370 |
Top Industries Employing Food Servers, Nonrestaurant
The bulk of food servers, nonrestaurant are found across these industries:
| Industry | Employment | Median annual wage |
|---|---|---|
| Health Care and Social Assistance | 175,940 | $34,680 |
| Accommodation and Food Services | 60,730 | $33,920 |
| Administrative and Support and Waste Management and Remediation Services | 10,260 | $33,800 |
| Arts, Entertainment, and Recreation | 8,250 | $31,470 |
| Information | 3,420 | $33,920 |
| Educational Services | 2,970 | $34,930 |
| Other Services (except Public Administration) | 1,790 | $37,990 |
| Retail Trade | 1,410 | $34,360 |
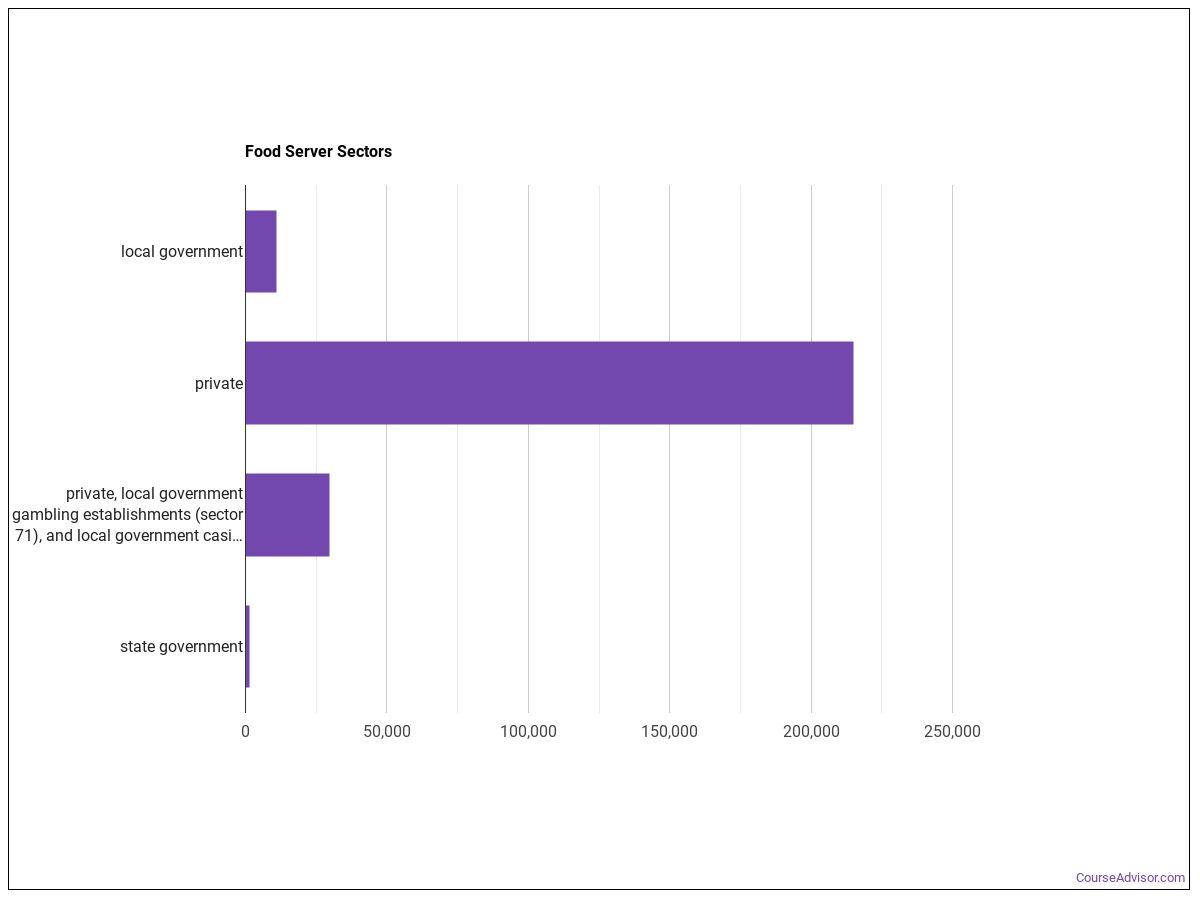
Food Servers, Nonrestaurant work in the following industries:

Tech Stack
- Web page creation and editing software: Facebook (hot technology)
- Office suite software: Microsoft Office software (hot technology)
- Electronic mail software: Microsoft Outlook (hot technology)
- Operating system software: Microsoft Windows (hot technology)
The Day-to-Day Environment
Daily working conditions for food servers, nonrestaurant is shaped by the following characteristics:
- Spend Time Standing
- Face-to-Face Discussions with Individuals and Within Teams
- Spend Time Walking or Running
- Time Pressure
- Physical Proximity
Education and Training
Entry-level food servers, nonrestaurant positions require a high school diploma or equivalent as the typical entry-level education. This occupation sits in Some Preparation Needed (Job Zone 2), indicating the level of preparation typically expected.
Similar Occupations
Similar Occupations
- Food Service Managers (Primary-Long)
- Chefs and Head Cooks (Supplemental)
- First-Line Supervisors of Food Preparation and Serving Workers (Supplemental)
- Cooks, Fast Food (Supplemental)
- Cooks, Institution and Cafeteria (Primary-Long)
- Cooks, Private Household (Supplemental)
- Cooks, Restaurant (Primary-Long)
- Cooks, Short Order (Primary-Long)
Sources
Statistics shown above are sourced from the following authoritative sources:
- U.S. Bureau of Labor Statistics — Occupational Employment and Wage Statistics (OEWS) for employment and wage data by state and industry.
- BLS Employment Projections for total employment and growth forecasts.
- O*NET (Occupational Information Network) for skills, knowledge, tasks, work activities, work context, technology, and education-zone data.
SOC code: 35-3041.00 (Food Servers, Nonrestaurant).
Course Advisor provides higher-education, college and university, degree, program, career, salary, and other helpful information to students, faculty, institutions, and other internet audiences. Presented information and data are subject to change. Inclusion on this website does not imply or represent a direct relationship with the company, school, or brand. Information, though believed correct at time of publication, may not be correct, and no warranty is provided. Contact the schools to verify any information before relying on it. Financial aid may be available for those who qualify. The displayed options may include sponsored or recommended results, not necessarily based on your preferences.
© Course Advisor – All Rights Reserved.