Business Operations Specialists, All Other in Illinois
Want to work as a Business Operations Specialists, All Other in Illinois? Here’s what you need to know. All business operations specialists not listed separately.
What do Business Operations Specialists, All Other Make in Illinois?
For a business operations specialists, all other working in Illinois, the typical annual salary is $77,980 per year (or about $37.49/hour).Pay can range from $43,980 at the 10th percentile to $133,120 at the 90th percentile.
| Wage Statistic | Annual | Hourly |
|---|---|---|
| 10th percentile | $43,980 | $21.14 |
| 25th percentile | $57,390 | $27.59 |
| Median (50th) | $77,980 | $37.49 |
| 75th percentile | $104,030 | $50.02 |
| 90th percentile | $133,120 | $64.00 |

Location quotient — how concentrated this career is in Illinois nationwide is 0.94.
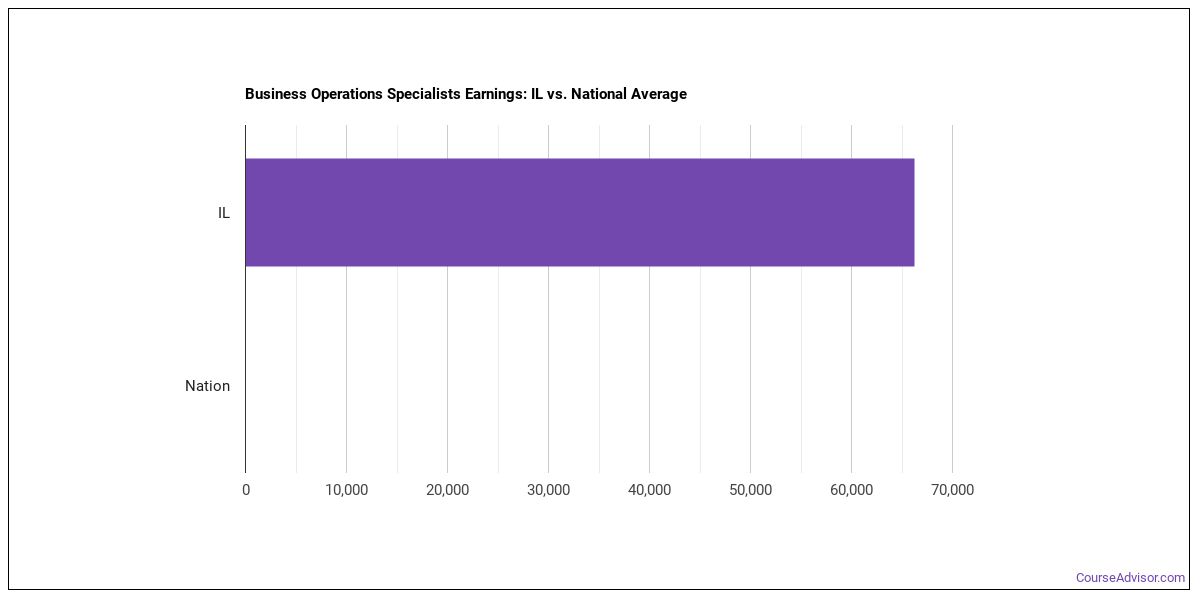
National Wage Comparison
Nationally, business operations specialists, all other earn a median of $113,637 per year ($54.63/hour), lower than the Illinois median.
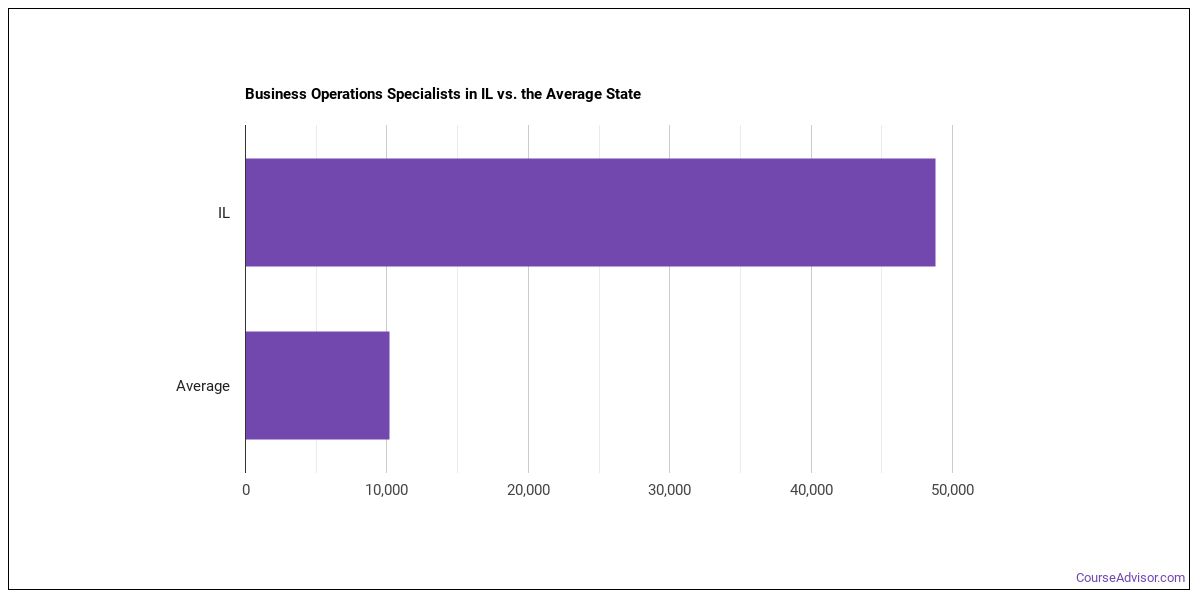
Employment Outlook
National employment for 626,510 business operations specialists, all other across the United States. In Illinois alone, around 41,810 people work in this role. That’s higher than the typical state, which employs around 10,450 business operations specialists, all other.

Top Illinois Metros for Business Operations Specialists, All Other
The metro areas below employ the most business operations specialists, all other in Illinois.
| Metro Area | Number Employed | Annual Median Salary |
|---|---|---|
| Chicago-Naperville-Elgin, IL-IN | 27,950 | $78,320 |
| Springfield, IL | 2,290 | $93,590 |
| Peoria, IL | 940 | $73,110 |
| Rockford, IL | 570 | $61,320 |
| Champaign-Urbana, IL | 510 | $64,270 |
| Bloomington, IL | 430 | $67,500 |
| Decatur, IL | 400 | $101,950 |
| Kankakee, IL | 150 | $74,670 |
Top States for Business Operations Specialists, All Other Employment
These states have the highest employment of business operations specialists, all other work.
| State | Number Employed |
|---|---|
| California | 168,180 |
| Texas | 92,850 |
| Georgia | 78,990 |
| Florida | 68,130 |
| Washington | 48,470 |
| Colorado | 46,350 |
| Virginia | 45,720 |
| Illinois | 41,810 |
| North Carolina | 40,580 |
| Maryland | 38,450 |
| District of Columbia | 38,240 |
| New Jersey | 35,820 |
| Ohio | 31,820 |
| New York | 31,170 |
| Pennsylvania | 29,690 |
| Michigan | 23,490 |
| Massachusetts | 19,850 |
| Louisiana | 17,410 |
| Missouri | 17,320 |
| Oregon | 17,260 |
Highest-Paying States for Business Operations Specialists, All Other
Where business operations specialists, all other earn the most: business operations specialists, all other.
| State | Annual Median Salary |
|---|---|
| District of Columbia | $106,810 |
| Maryland | $100,740 |
| Alabama | $98,070 |
| Washington | $93,450 |
| Hawaii | $90,580 |
| Alaska | $90,150 |
| Colorado | $89,860 |
| Oklahoma | $89,170 |
| New Hampshire | $88,860 |
| New Jersey | $88,070 |
What Major Will Prepare You For This Career?
Programs that train for this career include:
- Business Administration & Management
- International Business
- Hospitality Management
- Business Support & Assistance
Featured schools near , edit
Also Known As
Administrative Analyst, Administrative Assistant, Attendance Officer, Bar Examiner, Branch Operation Evaluation Manager, Business Agent, Business Development Assistant, Business Opportunity and Property Investment Broker, Business Planner, Business Practices Officer, Business Service Specialist, Campaign Director, Campaign Worker, Campaigner, Caseworker.
References
- U.S. Bureau of Labor Statistics, Occupational Employment and Wage Statistics — https://www.bls.gov/oes/
- O*NET Online — https://www.onetonline.org/
- BLS Employment Projections — https://www.bls.gov/emp/
- O*NET-SOC code: 13-1199.00
Course Advisor provides higher-education, college and university, degree, program, career, salary, and other helpful information to students, faculty, institutions, and other internet audiences. Presented information and data are subject to change. Inclusion on this website does not imply or represent a direct relationship with the company, school, or brand. Information, though believed correct at time of publication, may not be correct, and no warranty is provided. Contact the schools to verify any information before relying on it. Financial aid may be available for those who qualify. The displayed options may include sponsored or recommended results, not necessarily based on your preferences.
© Course Advisor – All Rights Reserved.