Visual & Performing Arts Schools in Tennessee
In 2022-2023, 2,909 students earned their Visual & Performing Arts degrees in TN.
As a degree choice, Visual & Performing Arts is the 5th most popular major in the state.
Education Levels of Visual & Performing Arts Majors in Tennessee
Visual & Performing Arts majors in the state tend to have the following degree levels:
| Education Level | Number of Grads |
|---|---|
| Bachelor’s Degree | 2,310 |
| Associate Degree | 218 |
| Award Taking 1 to 2 Years | 181 |
| Award Taking 2 to 4 Years | 181 |
| Master’s Degree | 139 |
| Award Taking Less Than 1 Year | 44 |
| Post-Master’s Certificate | 12 |
| Postbaccalaureate Certificate | 12 |
| Doctor’s Degree (Research / Scholarship) | 5 |
| Doctor’s Degree (Professional Practice) | 5 |
| Doctor’s Degree (Other) | 5 |
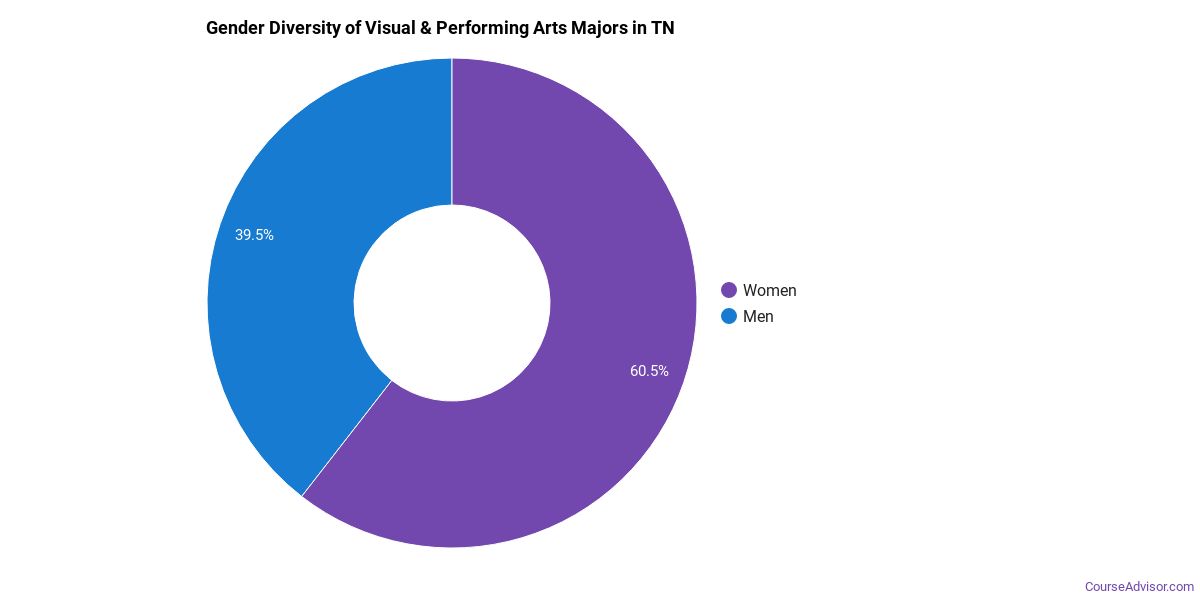
Gender Distribution
In Tennessee, a visual & performing arts major is more popular with women than with men.
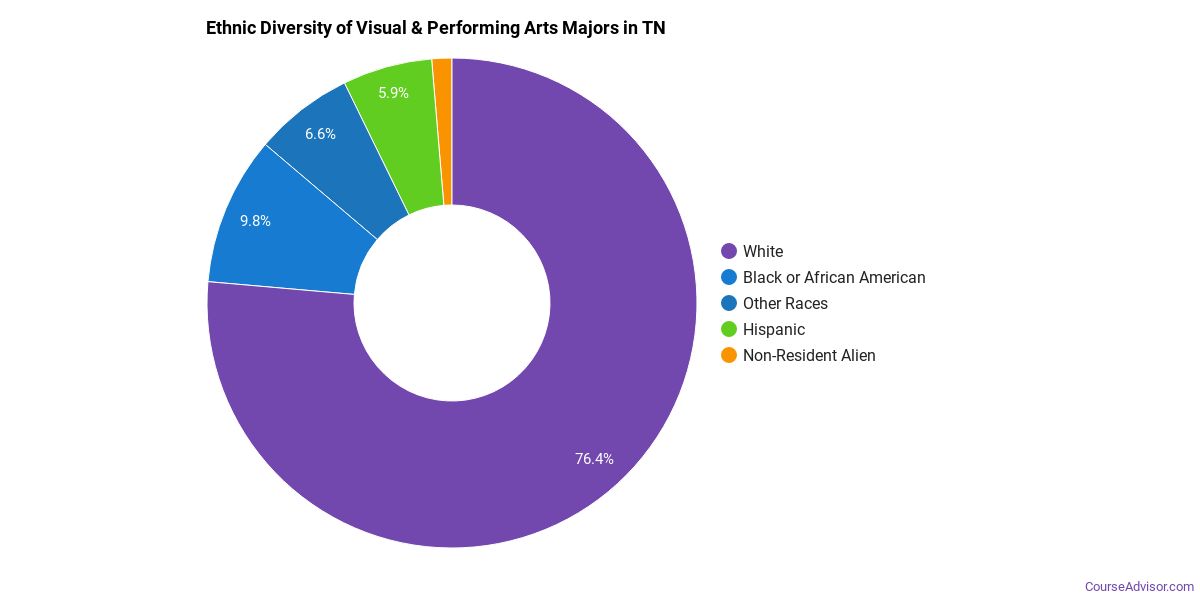
Racial Distribution
The racial distribution of visual & performing arts majors in Tennessee is as follows:
- Asian: 2.4%
- Black or African American: 11.3%
- Hispanic or Latino: 6.4%
- White: 71.8%
- Non-Resident Alien: 1.8%
- Other Races: 6.3%
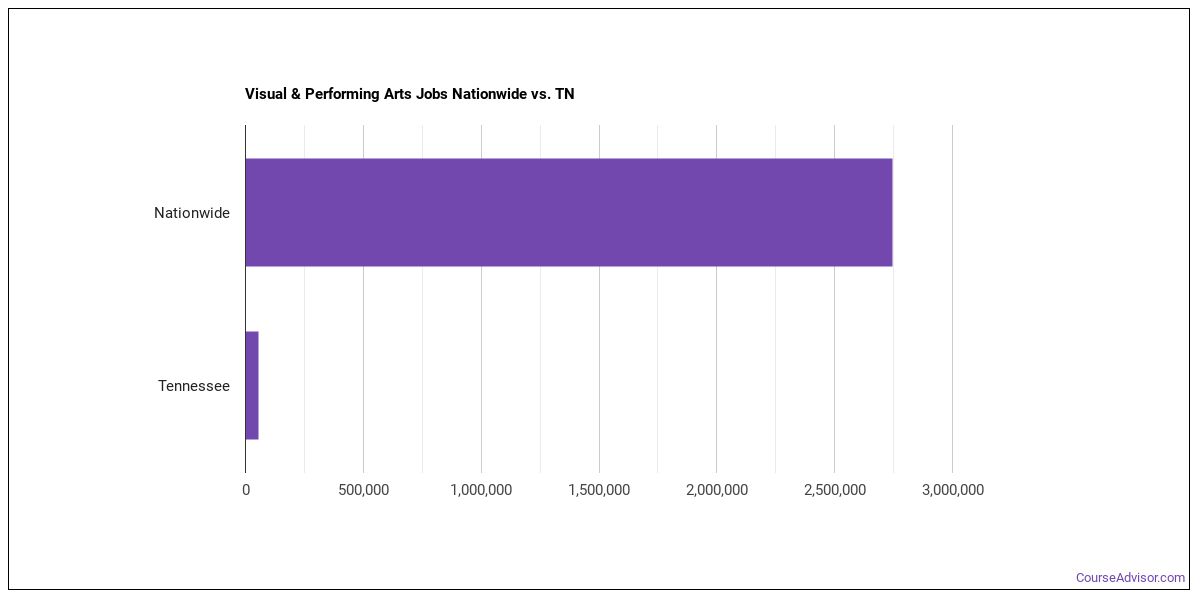
Jobs for Visual & Performing Arts Grads in Tennessee
In this state, there are 54,590 people employed in jobs related to a visual & performing arts degree, compared to 2,744,770 nationwide.
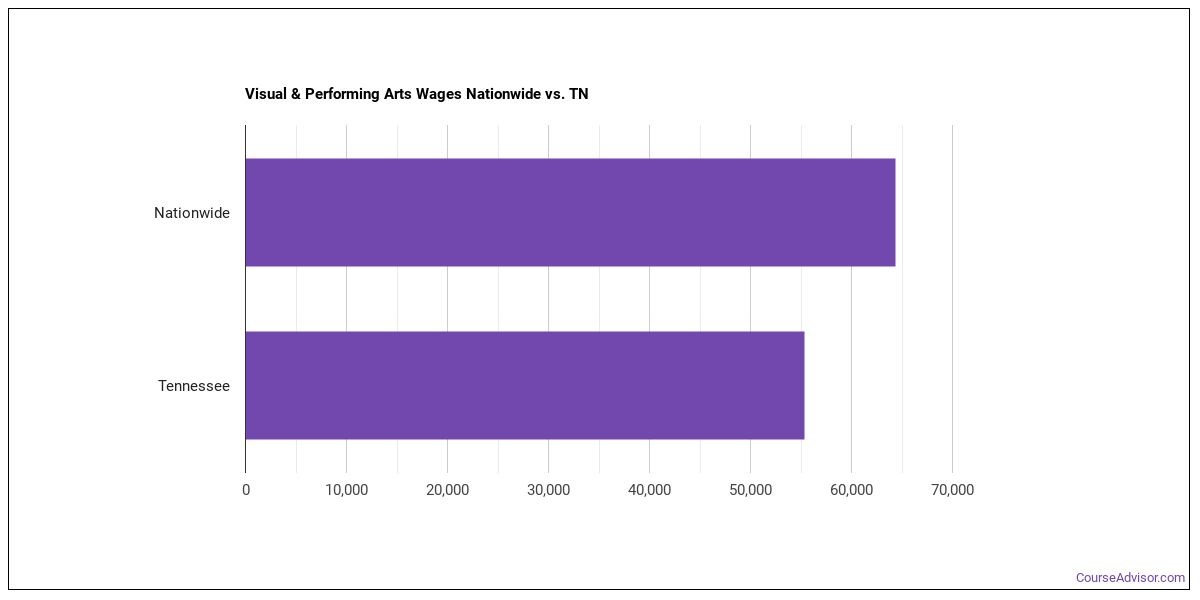
Wages for Visual & Performing Arts Jobs in Tennessee
In this state, visual & performing arts grads earn an average of $55,370. Nationwide, they make an average of $64,340.
Most Popular Visual & Performing Arts Programs in TN
There are 10 colleges in Tennessee that offer visual & performing arts degrees. Learn about the most popular 10 below:

59% of the teachers are full time. 12 to 1 is the student to faculty ratio. Of all the students who attend this school, 93% get financial aid.
Request Information
The student to faculty ratio is 16 to 1. Seeking financial aid? At this school, 100% of students receive it. The full-time teacher rate is 81%.
Request Information
Students enjoy a student to faculty ratio of 17 to 1. The full-time teacher rate is 71%. Seeking financial aid? At this school, 99% of students receive it.
Request Information
Seeking financial aid? At this school, 91% of students receive it. The full-time teacher rate is 85%. It takes the average student 4.31 years to graduate.
Request Information
This public school has an average net price of $12,886. The full-time teacher rate is 61%. Seeking financial aid? At this school, 100% of students receive it.
Request Information
A typical student attending Austin Peay State University will pay a net price of $15,914. Seeking financial aid? At this school, 100% of students receive it. The average student takes 4.53 years to complete their degree at Austin Peay State University.
Request Information
The full-time teacher rate is 50%. Most students complete their degree in 4.18 years. Seeking financial aid? At this school, 100% of students receive it.
Request Information
96% of students are awarded financial aid at this school. The full-time teacher rate is 68%. The student to faculty ratio is 16 to 1.
Request Information
An average student at Vanderbilt will pay a net price of $20,917. The full-time teacher rate is 82%. The student to faculty ratio is 7 to 1.
Request Information
Students who attend this private institution pay an average net price of $20,083. 12 to 1 is the student to faculty ratio. Of all the teachers who work at the school, 90% are considered full time.
Request InformationVisual & Performing Arts Careers in TN
Some of the careers visual & performing arts majors go into include:
| Job Title | TN Job Growth | TN Median Salary |
|---|---|---|
| Archivists | 20% | $35,100 |
| Producers and Directors | 18% | $52,070 |
| Interior Designers | 8% | $45,910 |
| Artists | 0% | $35,190 |
Explore Major by State
Alabama
Arkansas
Connecticut
Florida
Idaho
Iowa
Louisiana
Massachusetts
Mississippi
Nebraska
New Jersey
North Carolina
Oklahoma
Rhode Island
Tennessee
Vermont
West Virginia
View Nationwide Visual & Performing Arts Report
References
- College Factual
- National Center for Education Statistics
- O*NET Online
- Image Credit: By Bonnielou2013 under License
More about our data sources and methodologies.
Course Advisor provides higher-education, college and university, degree, program, career, salary, and other helpful information to students, faculty, institutions, and other internet audiences. Presented information and data are subject to change. Inclusion on this website does not imply or represent a direct relationship with the company, school, or brand. Information, though believed correct at time of publication, may not be correct, and no warranty is provided. Contact the schools to verify any information before relying on it. Financial aid may be available for those who qualify. The displayed options may include sponsored or recommended results, not necessarily based on your preferences.
© Course Advisor – All Rights Reserved.