Personal & Culinary Services Schools in Delaware
In 2022-2023, 489 students earned their Personal & Culinary Services degrees in DE.
In terms of popularity, Personal & Culinary Services is the 29th most popular major in the state out of a total 33 majors commonly available.
Education Levels of Personal & Culinary Services Majors in Delaware
Personal & Culinary Services majors in the state tend to have the following degree levels:
| Education Level | Number of Grads |
|---|---|
| Award Taking Less Than 1 Year | 274 |
| Award Taking 1 to 2 Years | 202 |
| Award Taking 2 to 4 Years | 202 |
| Associate Degree | 13 |
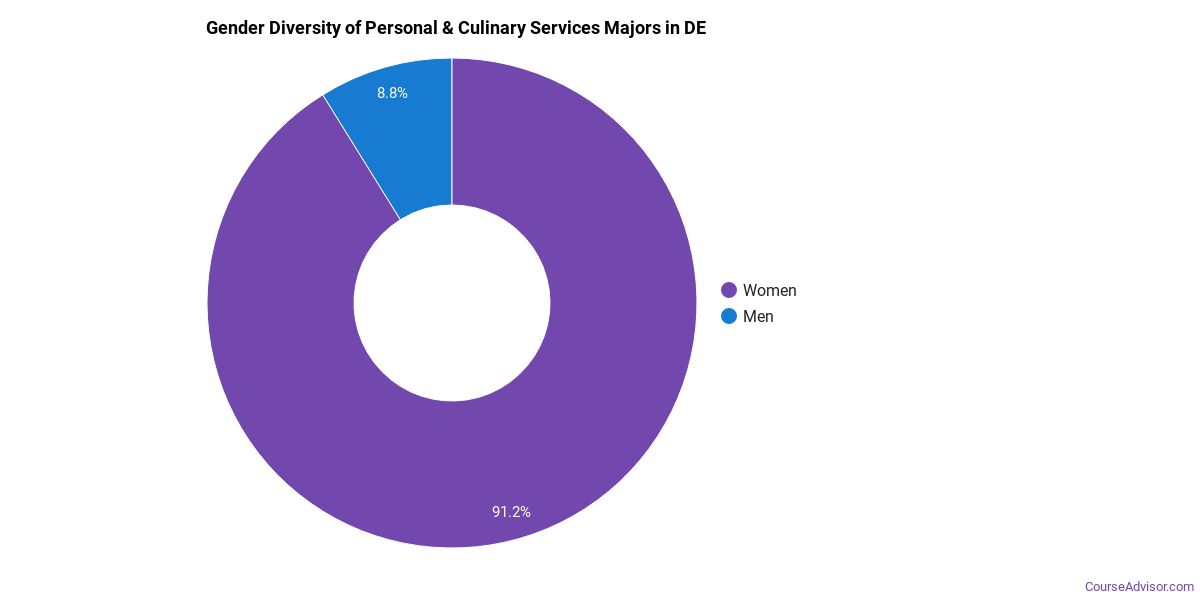
Gender Distribution
In Delaware, a personal & culinary services major is more popular with women than with men.
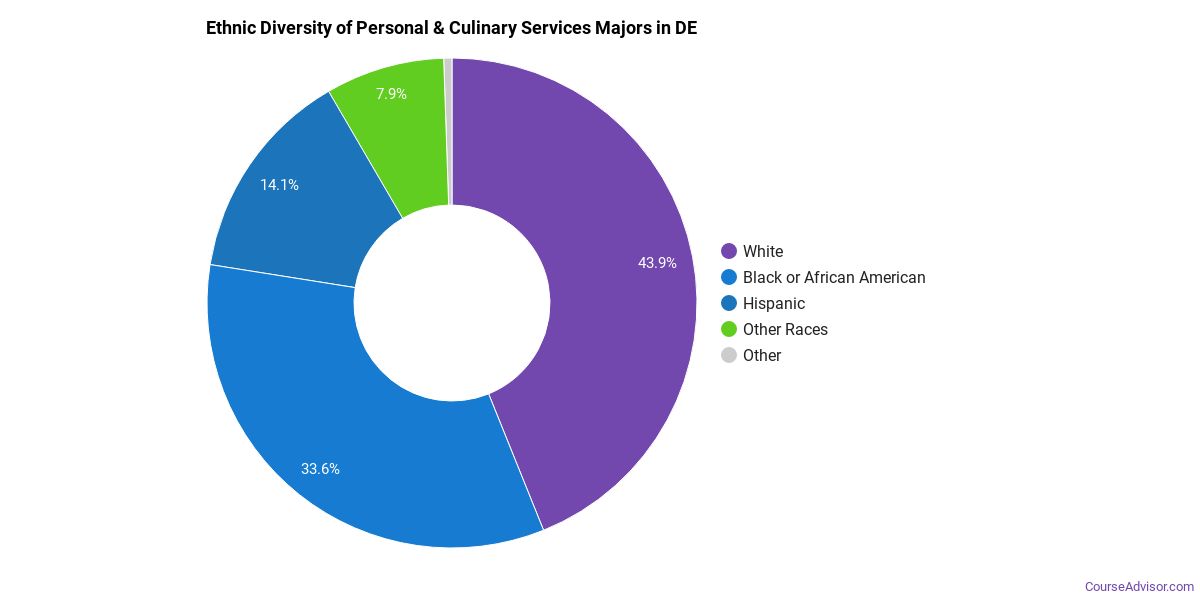
Racial Distribution
The racial distribution of personal & culinary services majors in Delaware is as follows:
- Asian: 0.6%
- Black or African American: 43.6%
- Hispanic or Latino: 17.0%
- White: 31.3%
- Non-Resident Alien: 0.2%
- Other Races: 7.4%
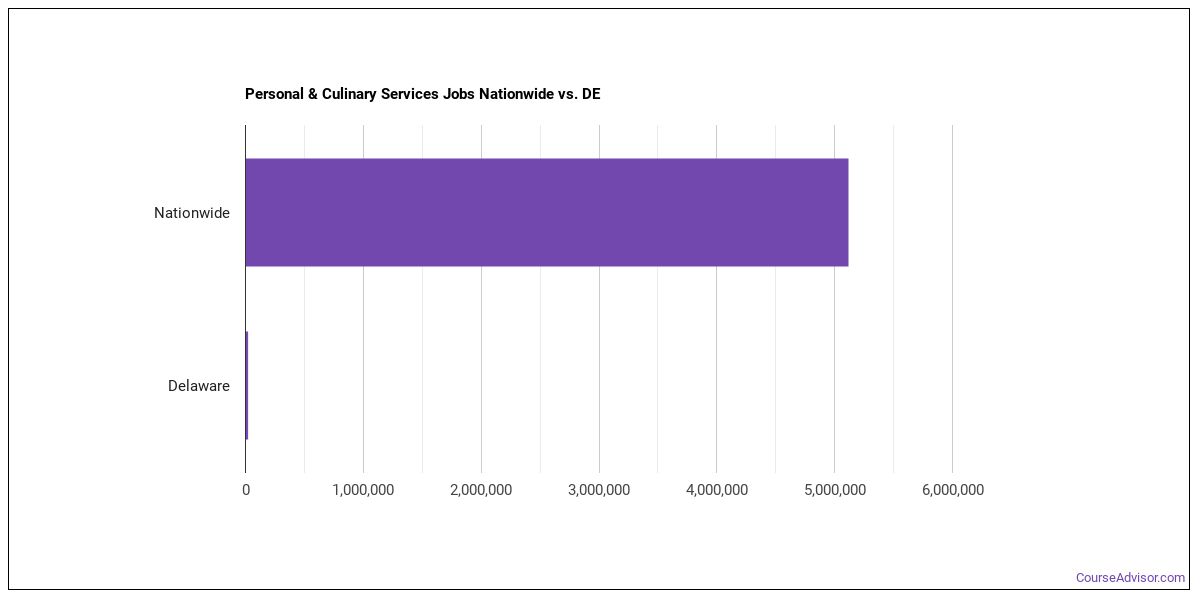
Jobs for Personal & Culinary Services Grads in Delaware
In this state, there are 17,920 people employed in jobs related to a personal & culinary services degree, compared to 5,118,330 nationwide.
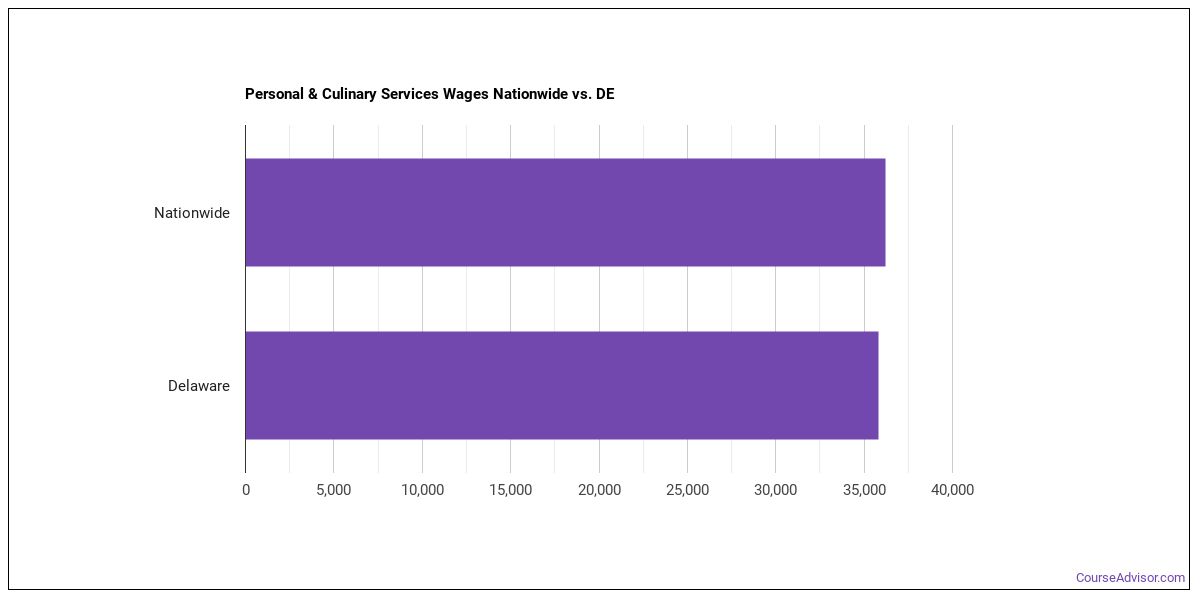
Wages for Personal & Culinary Services Jobs in Delaware
In this state, personal & culinary services grads earn an average of $35,810. Nationwide, they make an average of $36,190.
Most Popular Personal & Culinary Services Programs in DE
There is one school in the state that offers this degree.

89% of students get financical aid. Students enjoy a student to faculty ratio of 12 to 1. The full-time teacher rate is 36%.
Request InformationPersonal & Culinary Services Careers in DE
Some of the careers personal & culinary services majors go into include:
| Job Title | DE Job Growth | DE Median Salary |
|---|---|---|
| Chefs and Head Cooks | 12% | $57,340 |
| Food Service Managers | 8% | $71,830 |
| Bakers | 2% | $24,350 |
| Butchers and Meat Cutters | -3% | $41,230 |
Related Majors in Delaware
Below are some popular majors in the state that are similar to personal & culinary services.
| Major | Annual Graduates in DE |
|---|---|
| Mechanic & Repair Technologies | 34 |
| Transportation & Materials Moving | 14 |
View all majors related to Personal & Culinary Services
Explore Major by State
Alabama
Arkansas
Connecticut
Florida
Idaho
Iowa
Louisiana
Massachusetts
Mississippi
Nebraska
New Jersey
North Carolina
Oklahoma
Rhode Island
Tennessee
Vermont
West Virginia
View Nationwide Personal & Culinary Services Report
References
- College Factual
- National Center for Education Statistics
- O*NET Online
- Image Credit: By U.S. Army Europe Images under License
More about our data sources and methodologies.
Course Advisor provides higher-education, college and university, degree, program, career, salary, and other helpful information to students, faculty, institutions, and other internet audiences. Presented information and data are subject to change. Inclusion on this website does not imply or represent a direct relationship with the company, school, or brand. Information, though believed correct at time of publication, may not be correct, and no warranty is provided. Contact the schools to verify any information before relying on it. Financial aid may be available for those who qualify. The displayed options may include sponsored or recommended results, not necessarily based on your preferences.
© Course Advisor – All Rights Reserved.