Liberal Arts General Studies
Featured schools near , edit
Types of Degrees Liberal Arts General Studies Majors Are Earning
Those studying Liberal Arts General Studies may pursue degrees at several award levels.
| Award Level | Graduates |
|---|---|
| Certificate | 114,608 |
| Associate’s Degree | 363,119 |
| Bachelor’s Degree | 38,260 |
| Master’s Degree | 24,160 |
| Doctor’s Degree | 141 |
Sample Job Titles
Real job postings for Liberal Arts General Studies graduates include:
- Foreign Student Adviser Teacher
- Science Teacher
- Interdisciplinary Professor
- City Planning Teacher
- Naval Science Teacher
- Liberal Arts Teacher
- Adjunct Instructor
- Project Management Professor
- Assistant Professor
- Braille Teacher
- University Teacher
- Interior Design Teacher
- Foreign Service Teacher
- Survey Research Teacher
- Urban Planning Teacher
Who Is Earning a Degree in Liberal Arts General Studies?
Gender Distribution
This field skews predominantly female, with women earning 62.3% of Liberal Arts General Studies degrees.
| Gender | Graduates | Share |
|---|---|---|
| Women | 336,422 | 62.3% |
| Men | 203,902 | 37.7% |
Racial-Ethnic Diversity
At the national level, the racial-ethnic distribution of Liberal Arts General Studies graduates is as follows:
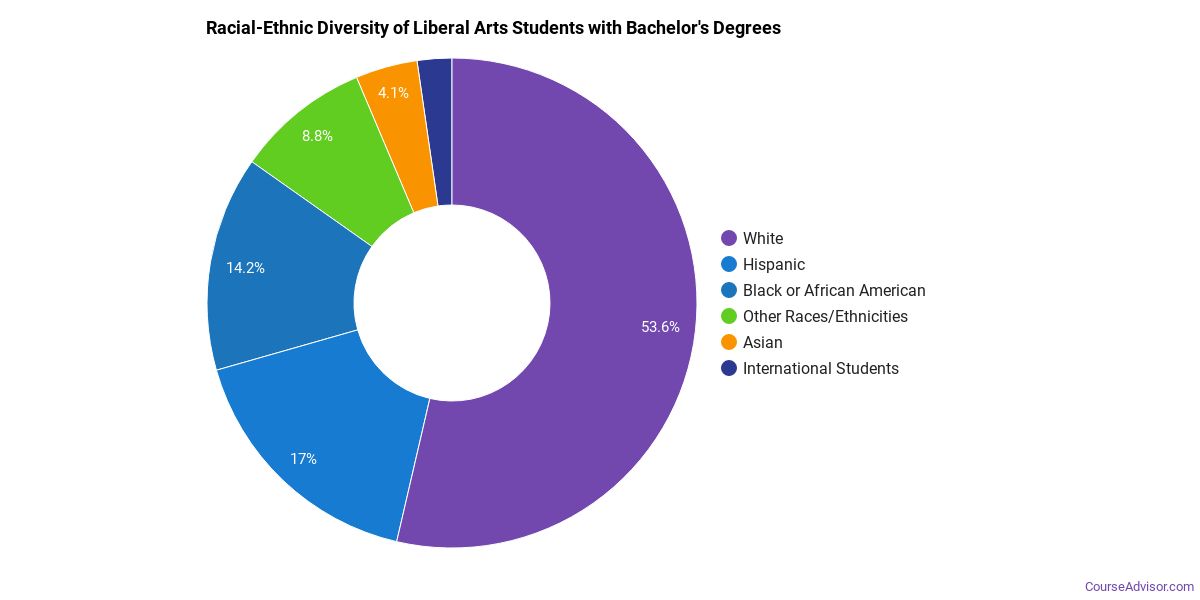
| Race / Ethnicity | Graduates | Share |
|---|---|---|
| White | 246,161 | 45.6% |
| Asian | 31,054 | 5.7% |
| Hispanic or Latino | 149,878 | 27.7% |
| Black or African American | 57,291 | 10.6% |
| American Indian / Alaska Native | 3,422 | 0.6% |
| Native Hawaiian / Pacific Islander | 1,436 | 0.3% |
| Two or More Races | 23,667 | 4.4% |
| Race Unknown | 16,834 | 3.1% |
| International Students | 10,581 | 2.0% |
See minority definition below.
How Much Do Liberal Arts General Studies Graduates Earn?
The U.S. Department of Education tracks median earnings of Liberal Arts General Studies graduates 1, 4, and 5 years after completion. These numbers tend to grow steadily as graduates gain experience and move into mid-career roles.
| Years Out | Median Earnings |
|---|---|
| 1 year | $32,164 |
| 4 years | $37,934 |
| 5 years | $44,008 |
By year 5 out, median earnings rise to $44,008 — roughly 37% above the 1-year mark.
Source: U.S. Department of Education College Scorecard, field-of-study earnings tracker.
Online Liberal Arts General Studies Programs
Distance learning is tracked by IPEDS for Liberal Arts General Studies. The table below shows how many graduates earned at least some of their coursework online (Distance-Ed Available) versus completing the entire program online (Distance-Ed Only).
| Award Level | Distance-Ed Available | Distance-Ed Only |
|---|---|---|
| Associate’s | 631 | 458 |
| Bachelor’s | 208 | 229 |
| Master’s | 38 | 32 |
| Doctoral (Research) | 2 | 1 |
Distance-Ed Only = degrees completed entirely online; Distance-Ed Available = degrees including at least some online coursework. Source: IPEDS Completions by Distance Education status.
Is a Degree in Liberal Arts General Studies Worth It?
Strictly by the federal earnings tracker, Liberal Arts General Studies graduates earn a median of $37,934 four years after completion — essentially in line with the national median for workers with only a high school diploma (~$38,000).
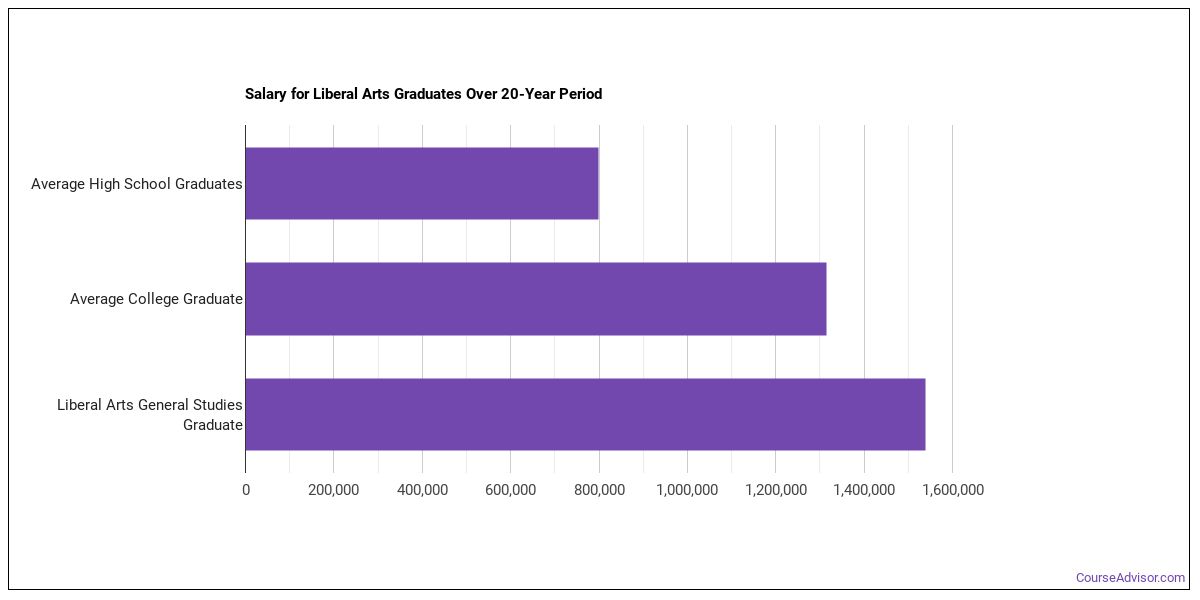
ROI estimate compares the program’s 4-yr median earnings against the 2023 BLS CPS median earnings for high-school-only workers. Source: U.S. Department of Education College Scorecard + BLS Current Population Survey.
Related Programs
You may also be interested in these closely related fields of study:
| Program | CIP Code |
|---|---|
| Liberal Arts Sciences Humanities | 24 |
| LIBERAL ARTS AND SCIENCES, GENERAL STUDIES AND HUMANITIES | 24.00 |
Explore Liberal Arts General Studies by State
Alabama
California
District of Columbia
Idaho
Kansas
Maryland
Mississippi
Nevada
New York
Oklahoma
South Carolina
Utah
West Virginia
Alaska
Colorado
Florida
Illinois
Kentucky
Massachusetts
Missouri
New Hampshire
North Carolina
Oregon
South Dakota
Vermont
Wisconsin
References
The racial-ethnic minorities count is calculated by taking the total number of students and subtracting white students and international students. This number is then divided by the total number of students to obtain the racial-ethnic minorities percentage.
- College Factual
- National Center for Education Statistics (IPEDS)
- O*NET Online
- U.S. Bureau of Labor Statistics
- U.S. Department of Education College Scorecard
More about our data sources and methodologies.
Course Advisor provides higher-education, college and university, degree, program, career, salary, and other helpful information to students, faculty, institutions, and other internet audiences. Presented information and data are subject to change. Inclusion on this website does not imply or represent a direct relationship with the company, school, or brand. Information, though believed correct at time of publication, may not be correct, and no warranty is provided. Contact the schools to verify any information before relying on it. Financial aid may be available for those who qualify. The displayed options may include sponsored or recommended results, not necessarily based on your preferences.
© Course Advisor – All Rights Reserved.