Criminal Justice & Corrections Undergraduate Certificates
There are 1,767 schools in the United States where you can earn aundergraduate certificate in Criminal Justice & Corrections. This degree is more popular with male students, and about52% were students from underrepresented racial-ethnic groups. Also, 0.7% of Criminal Justice & Corrections graduates were international students.
Featured schools near , edit
Education Levels of Criminal Justice & Corrections Majors
In the most recent year for which data is available, 102,547 degrees were awarded toCriminal Justice & Corrections majors across all award levels. The following table shows the number of diplomas awarded in Criminal Justice & Corrections at each degree level.
| Education Level | Number of Grads |
|---|---|
| Certificate (this page) | 6,240 |
| Associate’s Degree | 22,666 |
| Bachelor’s Degree | 45,807 |
| Master’s Degree | 26,113 |
| Doctor’s Degree | 280 |

Earnings of Criminal Justice & Corrections Majors With Undergraduate Certificates (All Award Levels)
The U.S. Department of Education reports a median salary for graduates with aundergraduate certificate in Criminal Justice & Corrections of $44,073 four years after graduation. These figures are reported program-wide, across all award levels.
This number may vary for many reasons. For instance, you may move to a location where people with your degree are rare and make more money.
| Years After Graduation | Median Earnings |
|---|---|
| 1 year | $40,812 |
| 4 years | $44,073 |
| 5 years | $49,815 |
Source: U.S. Department of Education College Scorecard, field-of-study earnings tracker (program-wide, all award levels).
Student Debt (All Award Levels)
We do not have the data to estimate the median debt for graduates with this degree.
Student Diversity
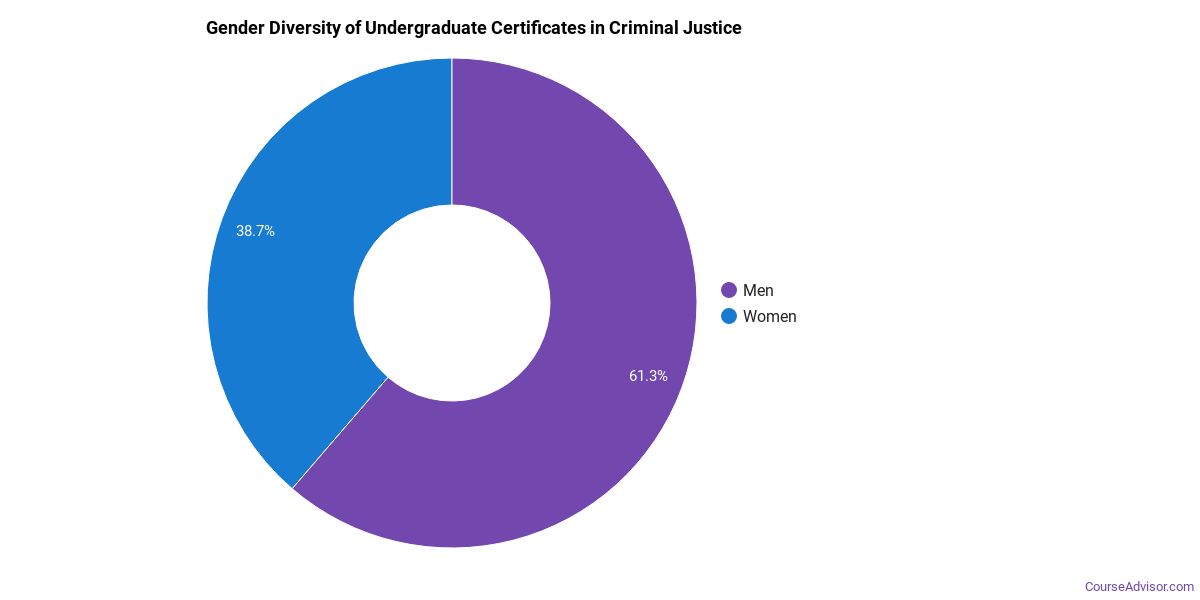
More men than women pursue undergraduate certificates in Criminal Justice & Corrections. About 66.6% of graduates in this field are men.
| Gender | Number of Grads |
|---|---|
| Men | 4,154 |
| Women | 2,086 |
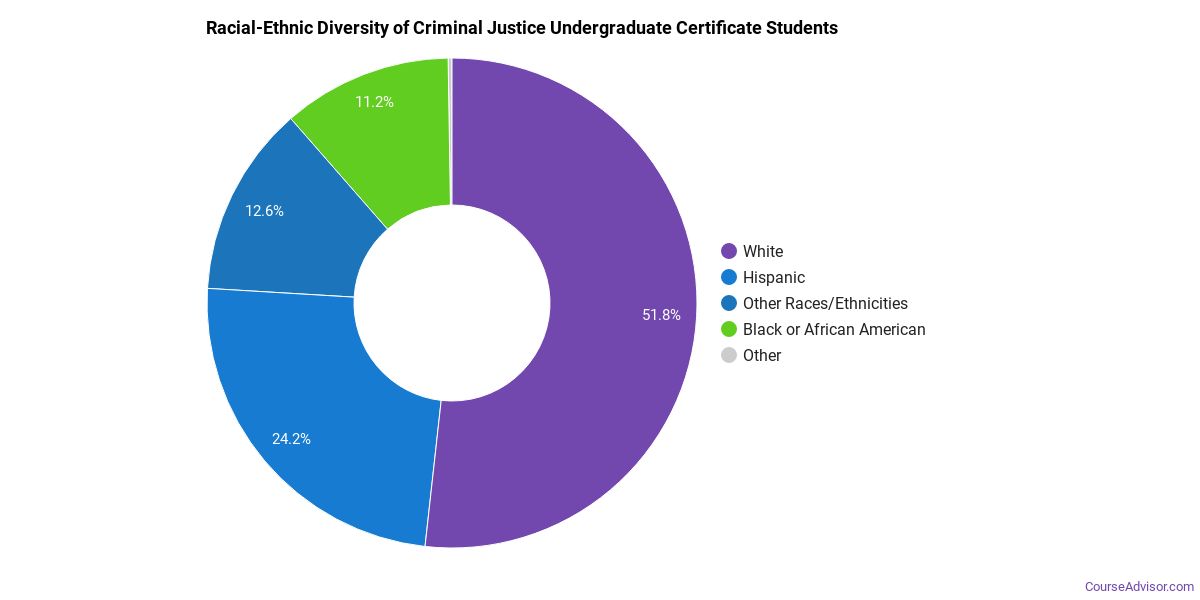
The racial-ethnic distribution of Criminal Justice & Corrections graduates is as follows:
| Race / Ethnicity | Number of Grads | Share |
|---|---|---|
| White | 2,935 | 47.0% |
| Asian | 120 | 1.9% |
| Hispanic or Latino | 1,535 | 24.6% |
| Black or African American | 550 | 8.8% |
| American Indian / Alaska Native | 74 | 1.2% |
| Native Hawaiian / Pacific Islander | 26 | 0.4% |
| Two or More Races | 204 | 3.3% |
| Race Unknown | 753 | 12.1% |
| International Students | 43 | 0.7% |
This degree is not very popular with international students. Only 0.7% of graduates fall into this category.
See the minority definition in the References below.
Most Popular Criminal Justice & Corrections Programs for Undergraduate Certificates
There are 1,884 colleges that offer a undergraduate certificate in Criminal Justice & Corrections. Learn more about the most popular below:

The most popular school in the United States for Criminal Justice & Corrections students seeking a undergraduate certificate is Southern New Hampshire University. This school awarded 2,029 undergraduate certificates in Criminal Justice & Corrections in the most recent reporting year. Graduates who complete their undergraduate certificate in Criminal Justice & Corrections here go on to a median salary of $40,669.
Rio Salado College comes in at #2 on our list of the most popular colleges offering undergraduate certificates in Criminal Justice & Corrections. This school awarded 1,773 undergraduate certificates in Criminal Justice & Corrections in the most recent reporting year. Graduates who complete their undergraduate certificate in Criminal Justice & Corrections here go on to a median salary of $40,669.
CUNY John Jay College of Criminal Justice is a popular choice for Criminal Justice & Corrections majors seeking their undergraduate certificate. This school awarded 1,686 undergraduate certificates in Criminal Justice & Corrections in the most recent reporting year. Data shows that graduates who hold this degree go on to make a median salary of $40,669.
University of Phoenix-Arizona is a popular choice for Criminal Justice & Corrections majors seeking their undergraduate certificate. This school awarded 1,359 undergraduate certificates in Criminal Justice & Corrections in the most recent reporting year. Graduates who complete their undergraduate certificate in Criminal Justice & Corrections here go on to a median salary of $40,669.
Liberty University is a popular choice for Criminal Justice & Corrections majors seeking their undergraduate certificate. During the most recent year for which we have data, 1,196 people received their undergraduate certificate in Criminal Justice & Corrections from this school. Data shows that graduates who hold this degree go on to make a median salary of $40,669.
Purdue University Global comes in at #6 on our list of the most popular colleges offering undergraduate certificates in Criminal Justice & Corrections. During the most recent year for which we have data, 1,044 people received their undergraduate certificate in Criminal Justice & Corrections from this school. Data shows that graduates who hold this degree go on to make a median salary of $40,669.
Sam Houston State University is a popular choice for Criminal Justice & Corrections majors seeking their undergraduate certificate. During the most recent year for which we have data, 931 people received their undergraduate certificate in Criminal Justice & Corrections from this school. Graduates who complete their undergraduate certificate in Criminal Justice & Corrections here go on to a median salary of $40,669.
Santa Ana College is a popular choice for Criminal Justice & Corrections majors seeking their undergraduate certificate. This school awarded 915 undergraduate certificates in Criminal Justice & Corrections in the most recent reporting year. Graduates who complete their undergraduate certificate in Criminal Justice & Corrections here go on to a median salary of $40,669.
American Public University System is a popular choice for Criminal Justice & Corrections majors seeking their undergraduate certificate. During the most recent year for which we have data, 864 people received their undergraduate certificate in Criminal Justice & Corrections from this school. Data shows that graduates who hold this degree go on to make a median salary of $40,669.
University of Virginia-Main Campus comes in at #10 on our list of the most popular colleges offering undergraduate certificates in Criminal Justice & Corrections. During the most recent year for which we have data, 728 people received their undergraduate certificate in Criminal Justice & Corrections from this school. Data shows that graduates who hold this degree go on to make a median salary of $40,669.
East Los Angeles College is a popular choice for Criminal Justice & Corrections majors seeking their undergraduate certificate. This school awarded 713 undergraduate certificates in Criminal Justice & Corrections in the most recent reporting year. Graduates who complete their undergraduate certificate in Criminal Justice & Corrections here go on to a median salary of $40,669.
Ivy Tech Community College comes in at #12 on our list of the most popular colleges offering undergraduate certificates in Criminal Justice & Corrections. This school awarded 704 undergraduate certificates in Criminal Justice & Corrections in the most recent reporting year. Data shows that graduates who hold this degree go on to make a median salary of $40,669.
Eastern Gateway Community College comes in at #13 on our list of the most popular colleges offering undergraduate certificates in Criminal Justice & Corrections. During the most recent year for which we have data, 697 people received their undergraduate certificate in Criminal Justice & Corrections from this school. Graduates who complete their undergraduate certificate in Criminal Justice & Corrections here go on to a median salary of $40,669.
Trinity Valley Community College is a popular choice for Criminal Justice & Corrections majors seeking their undergraduate certificate. This school awarded 687 undergraduate certificates in Criminal Justice & Corrections in the most recent reporting year. Data shows that graduates who hold this degree go on to make a median salary of $40,669.
Florida State University is a popular choice for Criminal Justice & Corrections majors seeking their undergraduate certificate. This school awarded 657 undergraduate certificates in Criminal Justice & Corrections in the most recent reporting year. Data shows that graduates who hold this degree go on to make a median salary of $40,669.
American InterContinental University System comes in at #16 on our list of the most popular colleges offering undergraduate certificates in Criminal Justice & Corrections. This school awarded 628 undergraduate certificates in Criminal Justice & Corrections in the most recent reporting year. Graduates who complete their undergraduate certificate in Criminal Justice & Corrections here go on to a median salary of $40,669.
California State University-Sacramento comes in at #17 on our list of the most popular colleges offering undergraduate certificates in Criminal Justice & Corrections. During the most recent year for which we have data, 564 people received their undergraduate certificate in Criminal Justice & Corrections from this school. Data shows that graduates who hold this degree go on to make a median salary of $40,669.
San Diego State University is a popular choice for Criminal Justice & Corrections majors seeking their undergraduate certificate. During the most recent year for which we have data, 547 people received their undergraduate certificate in Criminal Justice & Corrections from this school. Graduates who complete their undergraduate certificate in Criminal Justice & Corrections here go on to a median salary of $40,669.
Colorado Technical University-Colorado Springs is a popular choice for Criminal Justice & Corrections majors seeking their undergraduate certificate. This school awarded 542 undergraduate certificates in Criminal Justice & Corrections in the most recent reporting year. Data shows that graduates who hold this degree go on to make a median salary of $40,669.
Santa Rosa Junior College comes in at #20 on our list of the most popular colleges offering undergraduate certificates in Criminal Justice & Corrections. This school awarded 540 undergraduate certificates in Criminal Justice & Corrections in the most recent reporting year. Graduates who complete their undergraduate certificate in Criminal Justice & Corrections here go on to a median salary of $40,669.
Criminal Justice & Corrections Focus Areas
| Major | Annual Degrees Awarded |
|---|---|
| Criminal Justice/Safety Studies | 41,895 |
| Criminal Justice/Law Enforcement Administration | 26,997 |
| Criminal Justice/Police Science | 20,474 |
| Corrections | 4,967 |
| Corrections and Criminal Justice, Other | 4,327 |
Explore Criminal Justice & Corrections by State
Alabama
California
District of Columbia
Idaho
Kansas
Maryland
Mississippi
Nevada
New York
Oklahoma
South Carolina
Utah
West Virginia
Alaska
Colorado
Florida
Illinois
Kentucky
Massachusetts
Missouri
New Hampshire
North Carolina
Oregon
South Dakota
Vermont
Wisconsin
Related Majors
Below are some popular majors similar to Criminal Justice & Corrections that also offer undergraduate certificates.
| Major | Annual Degrees Awarded |
|---|---|
| Fire Protection | 15,202 |
| Security Science and Technology | 9,173 |
| Homeland Security | 6,323 |
| Homeland Security, Law Enforcement, Firefighting and Related Protective Services, Other | 1,217 |
| HOMELAND SECURITY, LAW ENFORCEMENT, FIREFIGHTING AND RELATED PROTECTIVE SERVICES | — |
References
The racial-ethnic minority student count is calculated by taking the total number of students and subtracting white students, international students, and students whose race/ethnicity was unknown. This number is then divided by the total number of students to obtain the percentage of racial-ethnic minorities.
- College Factual
- National Center for Education Statistics (IPEDS)
- O*NET Online
- U.S. Bureau of Labor Statistics
- U.S. Department of Education College Scorecard
More about our data sources and methodologies.
Course Advisor provides higher-education, college and university, degree, program, career, salary, and other helpful information to students, faculty, institutions, and other internet audiences. Presented information and data are subject to change. Inclusion on this website does not imply or represent a direct relationship with the company, school, or brand. Information, though believed correct at time of publication, may not be correct, and no warranty is provided. Contact the schools to verify any information before relying on it. Financial aid may be available for those who qualify. The displayed options may include sponsored or recommended results, not necessarily based on your preferences.
© Course Advisor – All Rights Reserved.