Bachelor’s Degrees in History
Featured schools near , edit
Education Levels of History Majors
In 2020-2021, 25,656 earned their bachelor's degree in history. This makes it the 19th most popular bachelor's degree program in the country.
The following table shows the number of diplomas awarded in history at each degree level.
| Education Level | Number of Grads |
|---|---|
| Bachelor’s Degree | 25,656 |
| Master’s Degree | 3,509 |
| Associate Degree | 2,558 |
| Doctor’s Degree | 721 |
| Graduate Certificate | 161 |
| Basic Certificate | 121 |
| Undergraduate Certificate | 5 |
Earnings of History Majors With Bachelor’s Degrees
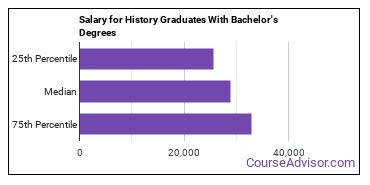
The median salary for graduates holding a bachelor's degree in history is $28,881. This number may vary for a lot of reasons. For instance, you may decide to move to a location where people with your degree are rare and make more money. A better approximation of salary is to look at the typical range of salaries. In this case the low is $25,677 and the high is $32,827.

Student Debt
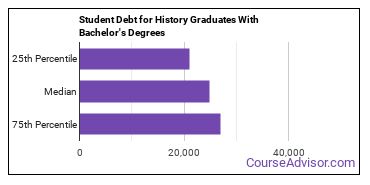
The median student debt for graduates holding a bachelor's degree in history is $24,952. The length of time it takes you to graduate and what college you attend can affect this number quite a bit. The chart below shows the range of accumulated debt loads. On the high side of the range, $26,977 is the debt load, and the debt load on the low side is $20,998.

The median monthly payment of a history graduate with a 10-year repayment plan is $325.
Student Diversity
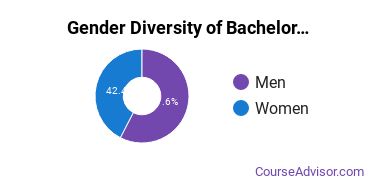
More men than women pursue bachelor's degrees in history. About 57.6% of graduates in this field are male.
| Gender | Number of Grads |
|---|---|
| Men | 14,774 |
| Women | 10,882 |

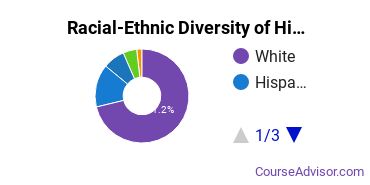
The racial-ethnic distribution of history bachelor’s degree students is as follows:
| Race/Ethnicity | Number of Grads |
|---|---|
| Asian | 904 |
| Black or African American | 1,171 |
| Hispanic or Latino | 3,642 |
| White | 17,632 |
| International Students | 451 |
| Other Races/Ethnicities | 1,856 |

Most Popular History Programs for Bachelor’s Degrees
There are 1,265 colleges that offer a bachelor’s degree in history. Learn more about the most popular 20 below:
The most popular school in the United States for history students seekinga bachelor's degree is University of California - Los Angeles. Roughly 44,500 attend the school each year. The average in-state tuition for full-time undergraduates is $11,442 per year, while in-state graduate students, on average, pay $11,442 per year. The history program at University of California - Los Angeles awarded 319 bachelor's degrees during the 2020-2021 school year. About 40% of this group were women, and 47% were students from an underrepresented racial-ethnic group.
Southern New Hampshire University is the 2nd most popular school in the nation for students seeking a bachelor's degree in history. Roughly 134,300 attend the school each year. The average in-state tuition for full-time undergraduates is $15,000 per year, while in-state graduate students, on average, pay $18,900 per year. The history program at Southern New Hampshire University awarded 275 bachelor's degrees during the 2020-2021 school year. Of these students, 47% were women and 16% were members of underrepresented racial-ethnic groups.
The 3rd most popular school in the country for history majors who are seeking their bachelor's degree is Liberty University. Each year, around 93,300 students seeking various degrees attend the university. The average in-state tuition for full-time undergraduates is $15,409 per year, while in-state graduate students, on average, pay $7,847 per year. During the 2020-2021 academic year, 198 people received their bachelor's degree in history from Liberty University. About 39% of this group were women, and 11% were students from an underrepresented racial-ethnic group.
The 4th most popular school in the country for history majors who are seeking their bachelor's degree is University of North Texas. Each year, around 40,900 students seeking various degrees attend the university. The average in-state tuition for full-time undergraduates is $8,295 per year, while in-state graduate students, on average, pay $6,350 per year. During the 2020-2021 academic year, 169 people received their bachelor's degree in history from UNT. Around 34% of these students were from an underrepresented racial-ethnic group, and 39% were women.
California State University - Long Beach comes in at #5 on our list of the most popular colleges offering bachelor's degrees in history. Roughly 40,000 attend the school each year. The average in-state tuition for full-time undergraduates is $5,742 per year, while in-state graduate students, on average, pay $7,176 per year. The history program at California State University - Long Beach awarded 161 bachelor's degrees during the 2020-2021 school year. Of these students, 39% were women and 60% were members of underrepresented racial-ethnic groups.
University of Washington - Seattle Campus is the 6th most popular school in the nation for students seeking a bachelor's degree in history. Roughly 48,100 attend the school each year. The average in-state tuition for full-time undergraduates is $10,927 per year, while in-state graduate students, on average, pay $16,605 per year. The history program at University of Washington - Seattle Campus awarded 155 bachelor's degrees during the 2020-2021 school year. Around 39% of these students were from an underrepresented racial-ethnic group, and 51% were women.
The 7th most popular school in the country for history majors who are seeking their bachelor's degree is Arizona State University - Skysong. Each year, around 53,900 students seeking various degrees attend the university. The average in-state tuition for full-time undergraduates is $10,710 per year, while in-state graduate students, on average, pay $9,774 per year. The history program at Arizona State University - Skysong awarded 152 bachelor's degrees during the 2020-2021 school year. About 49% of this group were women, and 26% were students from an underrepresented racial-ethnic group.
University of California - Santa Barbara is the 8th most popular school in the nation for students seeking a bachelor's degree in history. Each year, around 26,100 students seeking various degrees attend the university. The average in-state tuition for full-time undergraduates is $11,442 per year, while in-state graduate students, on average, pay $11,442 per year. During the 2020-2021 academic year, 150 people received their bachelor's degree in history from UCSB. Of these students, 42% were women and 53% were members of underrepresented racial-ethnic groups.
University of Central Florida is the 9th most popular school in the nation for students seeking a bachelor's degree in history. Roughly 71,800 attend the school each year. The average in-state tuition for full-time undergraduates is $4,478 per year, while in-state graduate students, on average, pay $6,916 per year. The history program at University of Central Florida awarded 145 bachelor's degrees during the 2020-2021 school year. Of these students, 36% were women and 29% were members of underrepresented racial-ethnic groups.
The 10th most popular school in the country for history majors who are seeking their bachelor's degree is University of Michigan - Ann Arbor. Each year, around 47,900 students seeking various degrees attend the university. The average in-state tuition for full-time undergraduates is $16,865 per year, while in-state graduate students, on average, pay $24,902 per year. The history program at University of Michigan - Ann Arbor awarded 142 bachelor's degrees during the 2020-2021 school year. Of these students, 55% were women and 20% were members of underrepresented racial-ethnic groups.
Texas A&M University - College Station is the 11th most popular school in the nation for students seeking a bachelor's degree in history. Each year, around 70,400 students seeking various degrees attend the university. The average in-state tuition for full-time undergraduates is $8,578 per year, while in-state graduate students, on average, pay $6,885 per year. For the 2020-2021 academic year, 139 bachelor's degrees were handed out to history majors at Texas A&M College Station. Around 34% of these students were from an underrepresented racial-ethnic group, and 35% were women.
University of North Carolina at Chapel Hill comes in at #12 on our list of the most popular colleges offering bachelor's degrees in history. Each year, around 30,000 students seeking various degrees attend the university. The average in-state tuition for full-time undergraduates is $7,019 per year, while in-state graduate students, on average, pay $10,552 per year. During the 2020-2021 academic year, 138 people received their bachelor's degree in history from UNC Chapel Hill. Of these students, 42% were women and 13% were members of underrepresented racial-ethnic groups.
University of Virginia - Main Campus comes in at #13 on our list of the most popular colleges offering bachelor's degrees in history. Each year, around 25,600 students seeking various degrees attend the university. The average in-state tuition for full-time undergraduates is $16,547 per year, while in-state graduate students, on average, pay $17,674 per year. During the 2020-2021 academic year, 137 people received their bachelor's degree in history from University of Virginia. About 40% of this group were women, and 21% were students from an underrepresented racial-ethnic group.
The 14th most popular school in the country for history majors who are seeking their bachelor's degree is American Public University System. Roughly 50,000 attend the school each year. The average in-state tuition for full-time undergraduates is $6,840 per year, while in-state graduate students, on average, pay $6,660 per year. During the 2020-2021 academic year, 136 people received their bachelor's degree in history from American Military University. Of these students, 22% were women and 26% were members of underrepresented racial-ethnic groups.
Ohio State University - Main Campus comes in at #15 on our list of the most popular colleges offering bachelor's degrees in history. Roughly 61,300 attend the school each year. The average in-state tuition for full-time undergraduates is $11,018 per year, while in-state graduate students, on average, pay $11,560 per year. For the 2020-2021 academic year, 135 bachelor's degrees were handed out to history majors at Ohio State. About 36% of this group were women, and 14% were students from an underrepresented racial-ethnic group.
Columbia University in the City of New York comes in at #16 on our list of the most popular colleges offering bachelor's degrees in history. Roughly 30,100 attend the school each year. The average in-state tuition for full-time undergraduates is $59,450 per year, while in-state graduate students, on average, pay $50,496 per year. The history program at Columbia University in the City of New York awarded 133 bachelor's degrees during the 2020-2021 school year. About 44% of this group were women, and 32% were students from an underrepresented racial-ethnic group.
University of California - Berkeley comes in at #17 on our list of the most popular colleges offering bachelor's degrees in history. Roughly 42,300 attend the school each year. The average in-state tuition for full-time undergraduates is $11,442 per year, while in-state graduate students, on average, pay $11,442 per year. The history program at University of California - Berkeley awarded 131 bachelor's degrees during the 2020-2021 school year. Around 44% of these students were from an underrepresented racial-ethnic group, and 40% were women.
University of North Carolina at Charlotte is the 18th most popular school in the nation for students seeking a bachelor's degree in history. Roughly 30,100 attend the school each year. The average in-state tuition for full-time undergraduates is $3,812 per year, while in-state graduate students, on average, pay $4,337 per year. The history program at University of North Carolina at Charlotte awarded 126 bachelor's degrees during the 2020-2021 school year. Around 22% of these students were from an underrepresented racial-ethnic group, and 35% were women.
The University of Texas at Austin comes in at #18 on our list of the most popular colleges offering bachelor's degrees in history. Each year, around 50,400 students seeking various degrees attend the university. The average in-state tuition for full-time undergraduates is $11,752 per year, while in-state graduate students, on average, pay $12,050 per year. The history program at The University of Texas at Austin awarded 126 bachelor's degrees during the 2020-2021 school year. Around 43% of these students were from an underrepresented racial-ethnic group, and 42% were women.
The 20th most popular school in the country for history majors who are seeking their bachelor's degree is University of California - Riverside. Each year, around 26,400 students seeking various degrees attend the university. The average in-state tuition for full-time undergraduates is $11,442 per year, while in-state graduate students, on average, pay $11,442 per year. The history program at University of California - Riverside awarded 125 bachelor's degrees during the 2020-2021 school year. Around 77% of these students were from an underrepresented racial-ethnic group, and 34% were women.
History Majors to Study
| Major | Annual Degrees Awarded |
|---|---|
| History | 25,656 |
Explore Major by State
Alabama
Arkansas
Connecticut
Florida
Idaho
Iowa
Louisiana
Massachusetts
Mississippi
Nebraska
New Jersey
North Carolina
Oklahoma
Rhode Island
Tennessee
Vermont
West Virginia
Related Majors
Below are some popular majors that are similar to history that offer bachelor’s degrees.
| Major | Annual Degrees Awarded |
|---|---|
| Social Sciences | 154,807 |
| Psychology | 134,434 |
| Communication & Journalism | 94,757 |
| Education | 94,293 |
| Family, Consumer & Human Sciences | 22,702 |
References
*The racial-ethnic minority student count is calculated by taking the total number of students and subtracting white students, international students, and students whose race/ethnicity was unknown. This number is then divided by the total number of students at the school to obtain the percentage of racial-ethnic minorities.
- College Factual
- National Center for Education Statistics
- O*NET Online
- Bureau of Labor Statistics
- Image Credit: By Abraham Ortelius under License
More about our data sources and methodologies.
Featured Schools
 Request Info
|
Southern New Hampshire University You have goals. Southern New Hampshire University can help you get there. Whether you need a bachelor's degree to get into a career or want a master's degree to move up in your current career, SNHU has an online program for you. Find your degree from over 200 online programs. Learn More > |


