Find Schools

Study Area & Zipcode

Health Professions in Virginia

Find Schools Near

Health Professions Schools in Virginia

In 2020-2021, 22,628 students earned their Health Professions degrees in VA.

In terms of popularity, Health Professions is the 2nd most popular major in the state out of a total 38 majors commonly available.

Education Levels of Health Professions Majors in Virginia

Health Professions majors in the state tend to have the following degree levels:

Education Level Number of Grads
Bachelor’s Degree 5,579
Associate Degree 4,951
Master’s Degree 3,848
Award Taking Less 12 Weeks 2,736
Award Taking Less Than 1 Year 2,736
Award Taking 12 Weeks to 1 Year 2,736
Doctor’s Degree (Research / Scholarship) 2,730
Doctor’s Degree (Professional Practice) 2,730
Doctor’s Degree (Other) 2,730
Award Taking 2 to 4 Years 2,382
Award Taking 1 to 2 Years 2,382
Postbaccalaureate Certificate 402
Post-Master’s Certificate 402

Gender Distribution

In Virginia, a health professions major is more popular with women than with men.

undefined

Racial Distribution

The racial distribution of health professions majors in Virginia is as follows:

  • Asian: 6.3%
  • Black or African American: 22.1%
  • Hispanic or Latino: 7.2%
  • White: 51.9%
  • Non-Resident Alien: 1.0%
  • Other Races: 11.4%
undefined

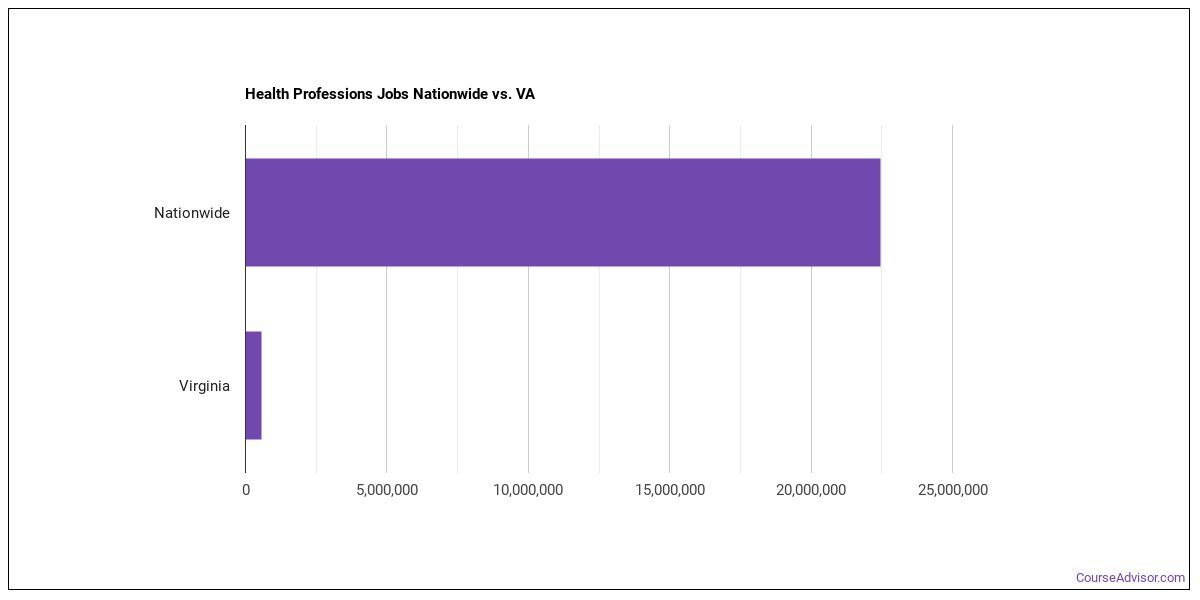
Jobs for Health Professions Grads in Virginia

550,570 people in the state and 22,470,500 in the nation are employed in jobs related to health professions.

undefined

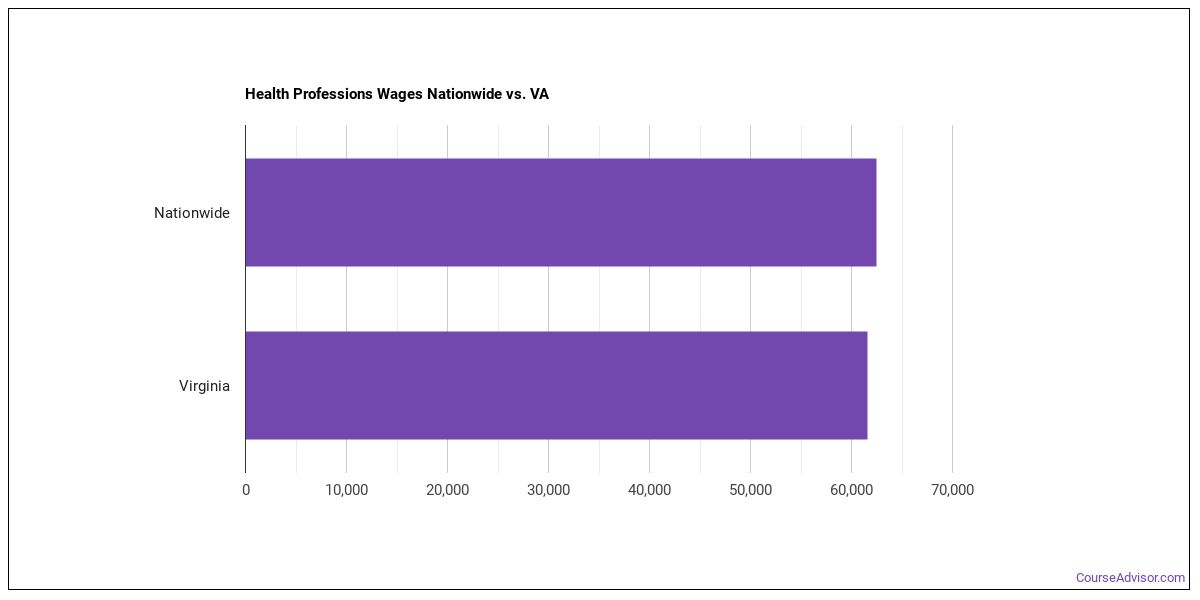
Wages for Health Professions Jobs in Virginia

In this state, health professions grads earn an average of $61,550. Nationwide, they make an average of $62,500.

undefined

There are 10 colleges in Virginia that offer health professions degrees. Learn about the most popular 10 below:

#1

Liberty University

Lynchburg
2,580 Degrees in Major Awarded
55% Graduation Rate
93,349 Total Students

34% of the teachers are full time. 99% of students are awarded financial aid at this school. The average student takes 4.47 years to complete their degree at Liberty University.

#2

ECPI University

Virginia Beach
1,626 Degrees in Major Awarded
43% Graduation Rate
14,353 Total Students

84% of students get financical aid. Roughly six years after entering college, graduates of this school earn $34,780 a year. An average student at ECPI University will pay a net price of $22,432.

1,171 Degrees in Major Awarded
67% Graduation Rate
29,070 Total Students

This public school has an average net price of $20,490. The 2.60% student loan default rate is lower than average. Seeking financial aid? At this school, 83% of students receive it.

#4

James Madison University

Harrisonburg
1,087 Degrees in Major Awarded
84% Graduation Rate
21,594 Total Students

60% of students get financical aid. The student loan default rate of 2.00% is a good sign that graduates can afford their loan payments. The student to faculty ratio is 17 to 1.

868 Degrees in Major Awarded
70% Graduation Rate
38,541 Total Students

75% of students get financical aid. This public college charges it's students an average net price of $19,551. The full-time teacher rate is 53%.

861 Degrees in Major Awarded
52% Graduation Rate
24,286 Total Students

94% of the teachers are full time. Seeking financial aid? At this school, 93% of students receive it. Graduates earn an average $42,015 after graduation.

#7

Shenandoah University

Winchester
617 Degrees in Major Awarded
58% Graduation Rate
4,174 Total Students

Roughly six years after entering college, graduates of this school earn $44,672 a year. Of all the teachers who work at the school, 59% are considered full time. The 3.60% student loan default rate is lower than average.

598 Degrees in Major Awarded
94% Graduation Rate
25,628 Total Students

The average student takes 4.06 years to complete their degree at University of Virginia. Of all the teachers who work at the school, 95% are considered full time. A typical student attending University of Virginia will pay a net price of $22,006.

565 Degrees in Major Awarded
59% Graduation Rate
10,695 Total Students

Of all the students who attend this school, 94% get financial aid. Students who attend this public school pay an average net price of $16,505. Graduates earn an average $42,066 after graduation.

537 Degrees in Major Awarded
61% Graduation Rate
2,692 Total Students

Students enjoy a student to faculty ratio of 10 to 1. 100% of students are awarded financial aid at this school. In their early career, Lynchburg grads earn an average salary of $40,857.

Health Professions Careers in VA

Some of the careers health professions majors go into include:

Job Title VA Job Growth VA Median Salary
Personal Care Aides 65% $19,700
Home Health Aides 51% $22,060
Physician Assistants 45% $99,980
Nurse Practitioners 44% $102,480
Orthotists and Prosthetists 36% $76,240
Physical Therapist Assistants 36% $60,880
Medical Assistants 35% $33,710
Occupational Therapy Assistants 35% $68,820
Marriage and Family Therapists 35% $49,570
Mental Health Counselors 35% $0
Physical Therapist Aides 34% $26,030
Software Applications Developers 33% $109,740
Phlebotomists 32% $35,240
Health Specialties Professors 31% $0
Veterinary Technologists and Technicians 30% $37,830
Hearing Aid Specialists 30% $38,780
Counselors 30% $0
Physical Therapists 30% $90,960
Substance Abuse Counselors 30% $0
Veterinarians 29% $97,500
Dental Laboratory Technicians 29% $48,240
Nursing Instructors and Professors 28% $67,540
Rehabilitation Counselors 28% $38,870
Athletic Trainers 28% $45,680
Occupational Therapists 26% $92,110
Medical Secretaries 26% $36,880
Oral and Maxillofacial Surgeons 25% $208,000
Healthcare Social Workers 25% $55,580
Massage Therapists 25% $39,350
Dental Hygienists 25% $81,240
Dental Assistants 25% $43,520
Substance Abuse Social Workers 24% $47,470
Dentists 24% $164,650
Diagnostic Medical Sonographers 24% $74,020
Audiologists 24% $74,530
Medical and Health Services Managers 24% $104,010
Computer and Information Research Scientists 23% $126,060
Occupational Therapy Aides 22% $31,900
Speech-Language Pathologists 22% $86,180
Nurse Anesthetists 21% $187,640
Respiratory Therapists 21% $59,160
Community Health Workers 21% $0
Optometrists 21% $120,940
Nursing Assistants 21% $27,270
Emergency Medical Technicians and Paramedics 20% $33,930
Dentists 20% $0
Psychology Professors 20% $66,930
Medical Scientists 20% $89,220
Family and General Practitioners 19% $182,220
Clinical, Counseling, and School Psychologists 18% $73,930
Licensed Practical and Licensed Vocational Nurses 18% $43,380
Clergy 17% $38,990
Medical and Clinical Laboratory Technicians 17% $0
Health Technologists and Technicians 17% $44,610
Fitness Trainers and Aerobics Instructors 16% $40,120
Physicians and Surgeons 16% $201,770
Medical and Clinical Laboratory Technologists 16% $0
Dispensing Opticians 16% $46,330
Ophthalmic Laboratory Technicians 15% $32,530
Dietitians and Nutritionists 15% $61,980
Medical Records and Health Information Technicians 15% $39,090
Registered Nurses 14% $68,000
Surgical Technologists 14% $48,270
Pharmacy Technicians 14% $30,940
Health Diagnosing and Treating Practitioners 14% $80,720
Chiropractors 14% $63,560
Physicists 14% $102,220
Social Work Professors 13% $0
Marketing Managers 13% $163,470
Computer User Support Specialists 13% $55,000
Medical Appliance Technicians 13% $39,120
Therapists 13% $59,320
Healthcare Practitioners and Technical Workers 12% $46,760
Exercise Physiologists 12% $56,780
Occupational Health and Safety Technicians 12% $52,540
Administrative Services Managers 12% $101,360
Nuclear Medicine Technologists 12% $71,710
Computer Workers 12% $104,840
Magnetic Resonance Imaging Technologists 12% $71,770
Natural Sciences Managers 11% $126,060
Medical Transcriptionists 11% $32,030
Managers 11% $130,590
Environmental Scientists and Specialists 11% $75,060
Engineers 11% $122,940
Life Scientists 11% $58,840
Healthcare Support Workers 10% $42,190
Psychiatric Aides 10% $26,430
Dietetic Technicians 10% $31,810
Cardiovascular Technologists and Technicians 10% $62,460
Radiation Therapists 9% $75,440
Sales Managers 9% $160,640
Medical Equipment Preparers 9% $33,150
Recreational Therapists 8% $45,180
Occupational Health and Safety Specialists 7% $68,840
Pharmacists 7% $128,260
Office and Administrative Support Worker Supervisors 6% $56,890
Fine Artists 5% $59,130
Psychiatric Technicians 4% $29,080
Epidemiologists 0% $65,800
Nuclear Technicians -3% $57,250
Computer Programmers -6% $92,550

View Nationwide Health Professions Report

References

More about our data sources and methodologies.

Featured Schools

Find Schools Near You

Our free school finder matches students with accredited colleges across the U.S.