Health/Medical Admin Services Undergraduate Certificates
A undergraduate certificate in Health/Medical Admin Services is offered at 1,689 colleges in the United States, where you can earn aundergraduate certificate in Health/Medical Admin Services. This degree is more popular with female students, and about59% were students from underrepresented racial-ethnic groups. Also, 0.2% of Health/Medical Admin Services graduates were international students.
Featured schools near , edit
Education Levels of Health/Medical Admin Services Majors
During the most recent year for which data is available, 90,166 people earned theirHealth/Medical Admin Services majors across all award levels. The following table shows the number of diplomas awarded in Health/Medical Admin Services at each degree level.
| Education Level | Number of Grads |
|---|---|
| Certificate (this page) | 22,648 |
| Associate’s Degree | 18,857 |
| Bachelor’s Degree | 16,785 |
| Master’s Degree | 30,506 |
| Doctor’s Degree | 428 |

Earnings of Health/Medical Admin Services Majors With Undergraduate Certificates (All Award Levels)
The U.S. Department of Education reports a median salary for graduates with aundergraduate certificate in Health/Medical Admin Services of $36,054 four years after graduation. These figures are reported program-wide, across all award levels.
A lot of factors can contribute to this number, such as the location of your workplace and the availability of other perks and bonuses.
| Years After Graduation | Median Earnings |
|---|---|
| 1 year | $36,041 |
| 4 years | $36,054 |
| 5 years | $40,847 |
Source: U.S. Department of Education College Scorecard, field-of-study earnings tracker (program-wide, all award levels).
Student Debt (All Award Levels)
We do not have the data to estimate the median debt for graduates with this degree.
Student Diversity
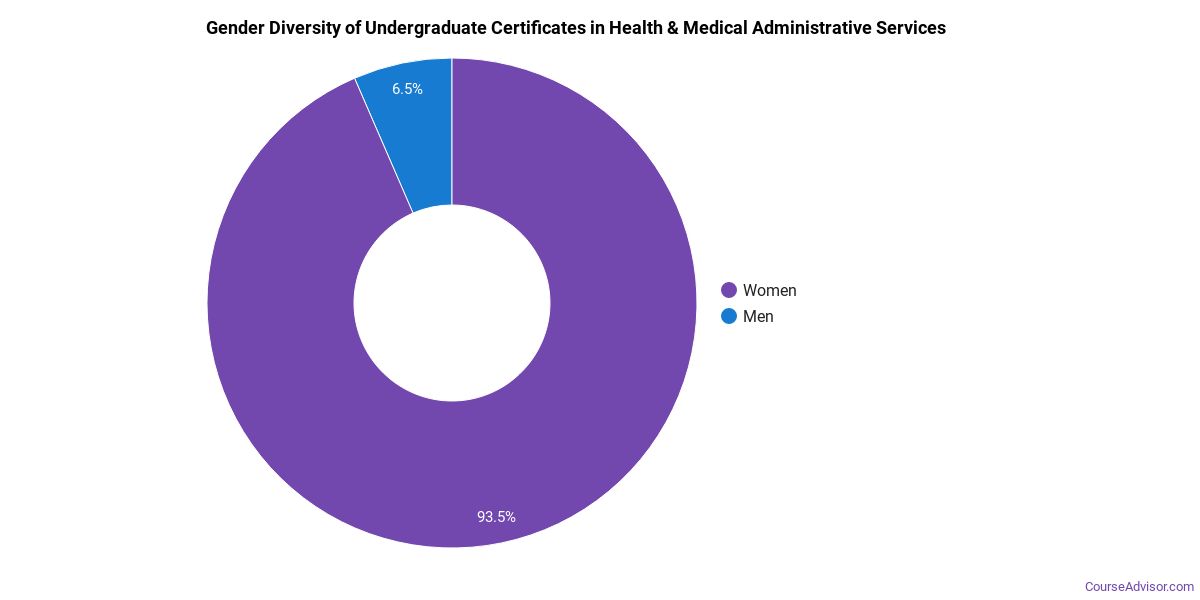
More women than men pursue their undergraduate certificate in Health/Medical Admin Services. About 94.0% of graduates with this degree are women.
| Gender | Number of Grads |
|---|---|
| Men | 1,353 |
| Women | 21,295 |
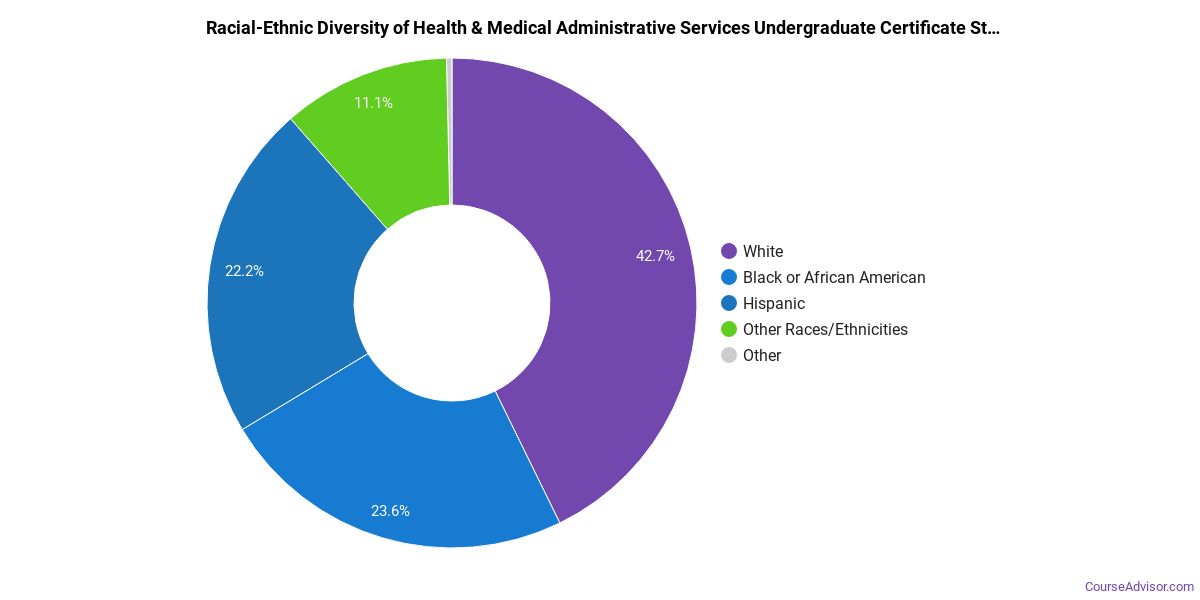
The racial-ethnic distribution of Health/Medical Admin Services graduates is as follows:
| Race / Ethnicity | Number of Grads | Share |
|---|---|---|
| White | 9,342 | 41.2% |
| Asian | 710 | 3.1% |
| Hispanic or Latino | 4,231 | 18.7% |
| Black or African American | 5,958 | 26.3% |
| American Indian / Alaska Native | 285 | 1.3% |
| Native Hawaiian / Pacific Islander | 109 | 0.5% |
| Two or More Races | 611 | 2.7% |
| Race Unknown | 1,347 | 5.9% |
| International Students | 55 | 0.2% |
This degree is not very popular with international students. Only 0.2% of graduates fall into this category.
See the minority definition in the References below.
Most Popular Health/Medical Admin Services Programs for Undergraduate Certificates
There are 1,951 colleges that offer a undergraduate certificate in Health/Medical Admin Services. Learn more about the most popular below:

Ultimate Medical Academy tops the list of the most popular schools in the U.S. for Health/Medical Admin Services majors seeking their undergraduate certificate. During the most recent year for which we have data, 10,364 people received their undergraduate certificate in Health/Medical Admin Services from this school. Graduates who complete their undergraduate certificate in Health/Medical Admin Services here go on to a median salary of $40,669.
DeVry University-Illinois is a popular choice for Health/Medical Admin Services majors seeking their undergraduate certificate. During the most recent year for which we have data, 4,605 people received their undergraduate certificate in Health/Medical Admin Services from this school. Graduates who complete their undergraduate certificate in Health/Medical Admin Services here go on to a median salary of $40,669.
University of Phoenix-Arizona is a popular choice for Health/Medical Admin Services majors seeking their undergraduate certificate. This school awarded 3,971 undergraduate certificates in Health/Medical Admin Services in the most recent reporting year. Data shows that graduates who hold this degree go on to make a median salary of $40,669.
Western Governors University comes in at #4 on our list of the most popular colleges offering undergraduate certificates in Health/Medical Admin Services. This school awarded 3,023 undergraduate certificates in Health/Medical Admin Services in the most recent reporting year. Data shows that graduates who hold this degree go on to make a median salary of $40,669.
NUC University comes in at #5 on our list of the most popular colleges offering undergraduate certificates in Health/Medical Admin Services. During the most recent year for which we have data, 1,649 people received their undergraduate certificate in Health/Medical Admin Services from this school. Data shows that graduates who hold this degree go on to make a median salary of $40,669.
Southern New Hampshire University is a popular choice for Health/Medical Admin Services majors seeking their undergraduate certificate. This school awarded 1,588 undergraduate certificates in Health/Medical Admin Services in the most recent reporting year. Graduates who complete their undergraduate certificate in Health/Medical Admin Services here go on to a median salary of $40,669.
Purdue University Global is a popular choice for Health/Medical Admin Services majors seeking their undergraduate certificate. During the most recent year for which we have data, 1,561 people received their undergraduate certificate in Health/Medical Admin Services from this school. Graduates who complete their undergraduate certificate in Health/Medical Admin Services here go on to a median salary of $40,669.
Ivy Tech Community College is a popular choice for Health/Medical Admin Services majors seeking their undergraduate certificate. During the most recent year for which we have data, 1,102 people received their undergraduate certificate in Health/Medical Admin Services from this school. Data shows that graduates who hold this degree go on to make a median salary of $40,669.
Capella University is a popular choice for Health/Medical Admin Services majors seeking their undergraduate certificate. This school awarded 1,044 undergraduate certificates in Health/Medical Admin Services in the most recent reporting year. Graduates who complete their undergraduate certificate in Health/Medical Admin Services here go on to a median salary of $40,669.
Bryant & Stratton College-Online is a popular choice for Health/Medical Admin Services majors seeking their undergraduate certificate. This school awarded 953 undergraduate certificates in Health/Medical Admin Services in the most recent reporting year. Graduates who complete their undergraduate certificate in Health/Medical Admin Services here go on to a median salary of $40,669.
Colorado Technical University-Colorado Springs is a popular choice for Health/Medical Admin Services majors seeking their undergraduate certificate. This school awarded 910 undergraduate certificates in Health/Medical Admin Services in the most recent reporting year. Graduates who complete their undergraduate certificate in Health/Medical Admin Services here go on to a median salary of $40,669.
Eastern Gateway Community College comes in at #12 on our list of the most popular colleges offering undergraduate certificates in Health/Medical Admin Services. During the most recent year for which we have data, 765 people received their undergraduate certificate in Health/Medical Admin Services from this school. Data shows that graduates who hold this degree go on to make a median salary of $40,669.
The College of Health Care Professions-Northwest is a popular choice for Health/Medical Admin Services majors seeking their undergraduate certificate. During the most recent year for which we have data, 672 people received their undergraduate certificate in Health/Medical Admin Services from this school. Data shows that graduates who hold this degree go on to make a median salary of $40,669.
Martinsburg College is a popular choice for Health/Medical Admin Services majors seeking their undergraduate certificate. During the most recent year for which we have data, 629 people received their undergraduate certificate in Health/Medical Admin Services from this school. Graduates who complete their undergraduate certificate in Health/Medical Admin Services here go on to a median salary of $40,669.
Rasmussen University-Minnesota is a popular choice for Health/Medical Admin Services majors seeking their undergraduate certificate. This school awarded 606 undergraduate certificates in Health/Medical Admin Services in the most recent reporting year. Graduates who complete their undergraduate certificate in Health/Medical Admin Services here go on to a median salary of $40,669.
Ashford University comes in at #16 on our list of the most popular colleges offering undergraduate certificates in Health/Medical Admin Services. During the most recent year for which we have data, 603 people received their undergraduate certificate in Health/Medical Admin Services from this school. Graduates who complete their undergraduate certificate in Health/Medical Admin Services here go on to a median salary of $40,669.
Grand Canyon University is a popular choice for Health/Medical Admin Services majors seeking their undergraduate certificate. This school awarded 521 undergraduate certificates in Health/Medical Admin Services in the most recent reporting year. Graduates who complete their undergraduate certificate in Health/Medical Admin Services here go on to a median salary of $40,669.
Louisiana State University-Shreveport is a popular choice for Health/Medical Admin Services majors seeking their undergraduate certificate. During the most recent year for which we have data, 490 people received their undergraduate certificate in Health/Medical Admin Services from this school. Data shows that graduates who hold this degree go on to make a median salary of $40,669.
Miller-Motte College-Chattanooga is a popular choice for Health/Medical Admin Services majors seeking their undergraduate certificate. This school awarded 460 undergraduate certificates in Health/Medical Admin Services in the most recent reporting year. Graduates who complete their undergraduate certificate in Health/Medical Admin Services here go on to a median salary of $40,669.
Carrington College-Sacramento comes in at #20 on our list of the most popular colleges offering undergraduate certificates in Health/Medical Admin Services. This school awarded 459 undergraduate certificates in Health/Medical Admin Services in the most recent reporting year. Data shows that graduates who hold this degree go on to make a median salary of $40,669.
Health/Medical Admin Services Focus Areas
| Major | Annual Degrees Awarded |
|---|---|
| Health/Health Care Administration/Management | 28,347 |
| Medical Insurance Specialist/Medical Biller | 11,963 |
| Health Information/Medical Records Technology/Technician | 11,828 |
| Medical Insurance Coding Specialist/Coder | 10,171 |
| Medical Administrative/Executive Assistant and Medical Secretary | 7,771 |
Explore Health/Medical Admin Services by State
Alabama
California
District of Columbia
Idaho
Kansas
Maryland
Mississippi
Nevada
New York
Oklahoma
South Carolina
Utah
West Virginia
Alaska
Colorado
Florida
Illinois
Kentucky
Massachusetts
Missouri
New Hampshire
North Carolina
Oregon
South Dakota
Vermont
Wisconsin
Related Majors
Below are some popular majors similar to Health/Medical Admin Services that also offer undergraduate certificates.
| Major | Annual Degrees Awarded |
|---|---|
| Registered Nursing, Nursing Administration, Nursing Research and Clinical Nursing | 311,372 |
| Practical Nursing, Vocational Nursing and Nursing Assistants | 99,987 |
| Allied Health Diagnostic, Intervention, and Treatment Professions | 90,379 |
| Allied Health and Medical Assisting Services | 80,693 |
| Public Health | 41,086 |
References
The racial-ethnic minority student count is calculated by taking the total number of students and subtracting white students, international students, and students whose race/ethnicity was unknown. This number is then divided by the total number of students to obtain the percentage of racial-ethnic minorities.
- College Factual
- National Center for Education Statistics (IPEDS)
- O*NET Online
- U.S. Bureau of Labor Statistics
- U.S. Department of Education College Scorecard
More about our data sources and methodologies.
Course Advisor provides higher-education, college and university, degree, program, career, salary, and other helpful information to students, faculty, institutions, and other internet audiences. Presented information and data are subject to change. Inclusion on this website does not imply or represent a direct relationship with the company, school, or brand. Information, though believed correct at time of publication, may not be correct, and no warranty is provided. Contact the schools to verify any information before relying on it. Financial aid may be available for those who qualify. The displayed options may include sponsored or recommended results, not necessarily based on your preferences.
© Course Advisor – All Rights Reserved.