Health & Medical Administrative Services Schools in Massachusetts
1,072 students earned Health & Medical Administrative Services degrees in Massachusetts in the 2022-2023 year.
In terms of popularity, Health & Medical Administrative Services is the 43rd most popular major in the state out of a total 305 majors commonly available.
Education Levels of Health & Medical Administrative Services Majors in Massachusetts
Health & Medical Administrative Services majors in the state tend to have the following degree levels:
| Education Level | Number of Grads |
|---|---|
| Master’s Degree | 520 |
| Bachelor’s Degree | 270 |
| Associate Degree | 120 |
| Award Taking Less Than 1 Year | 100 |
| Post-Master’s Certificate | 36 |
| Postbaccalaureate Certificate | 36 |
| Award Taking 1 to 2 Years | 21 |
| Award Taking 2 to 4 Years | 21 |
| Doctor’s Degree (Research / Scholarship) | 5 |
| Doctor’s Degree (Professional Practice) | 5 |
| Doctor’s Degree (Other) | 5 |
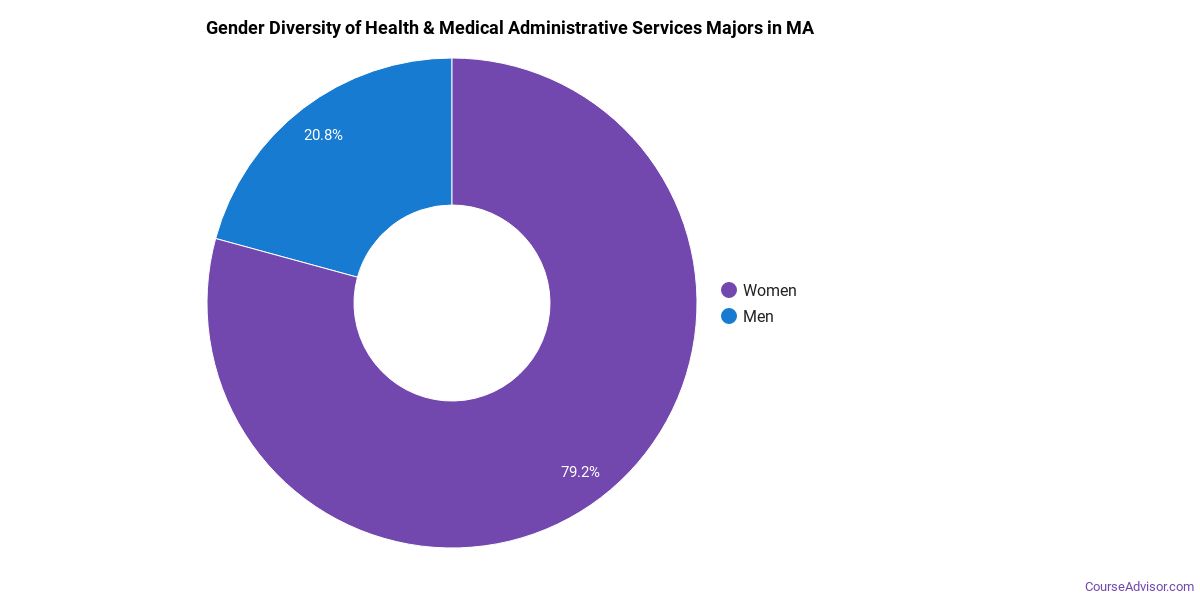
Gender Distribution
In Massachusetts, a health & medical administrative services major is more popular with women than with men.
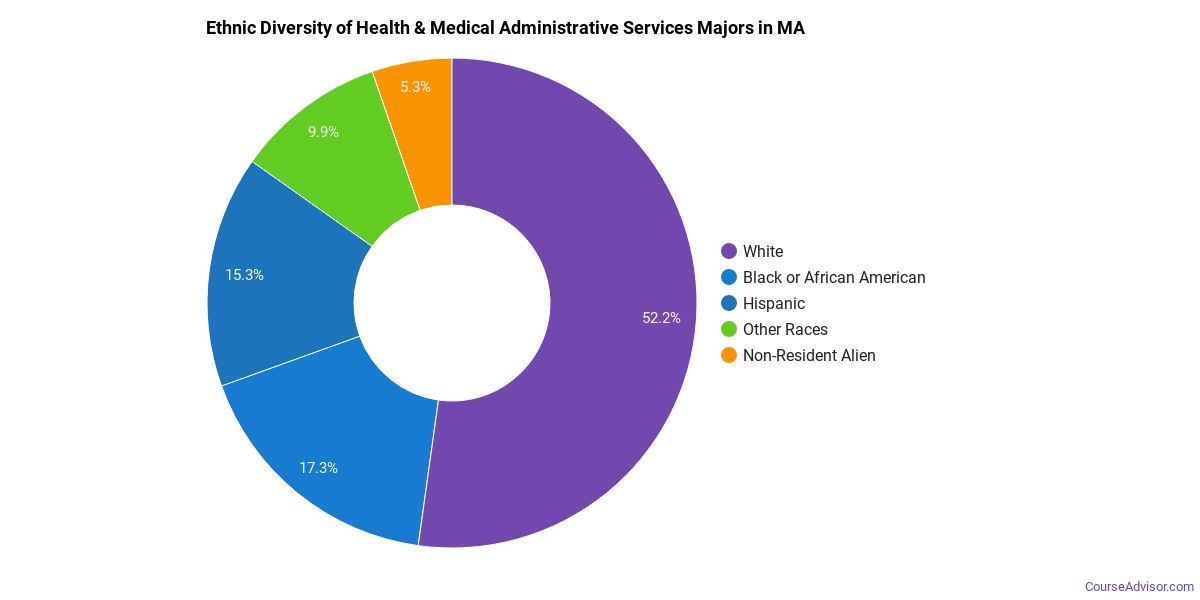
Racial Distribution
The racial distribution of health & medical administrative services majors in Massachusetts is as follows:
- Asian: 13.2%
- Black or African American: 12.7%
- Hispanic or Latino: 12.2%
- White: 46.7%
- Non-Resident Alien: 5.8%
- Other Races: 9.3%
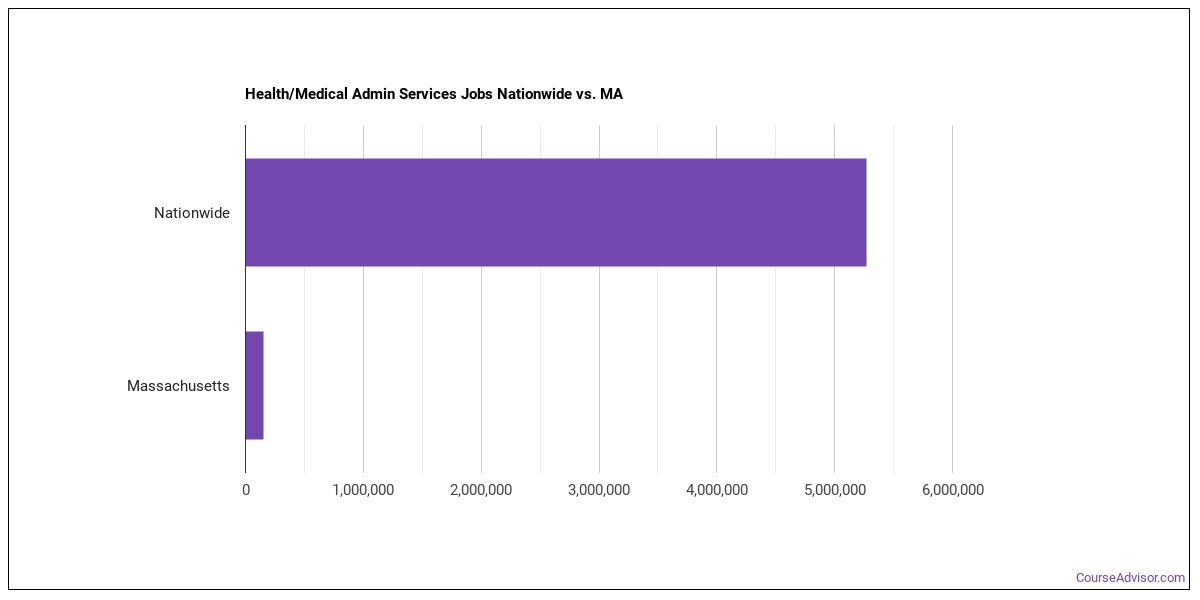
Jobs for Health & Medical Administrative Services Grads in Massachusetts
There are 151,750 people in the state and 5,266,990 people in the nation working in health & medical administrative services jobs.
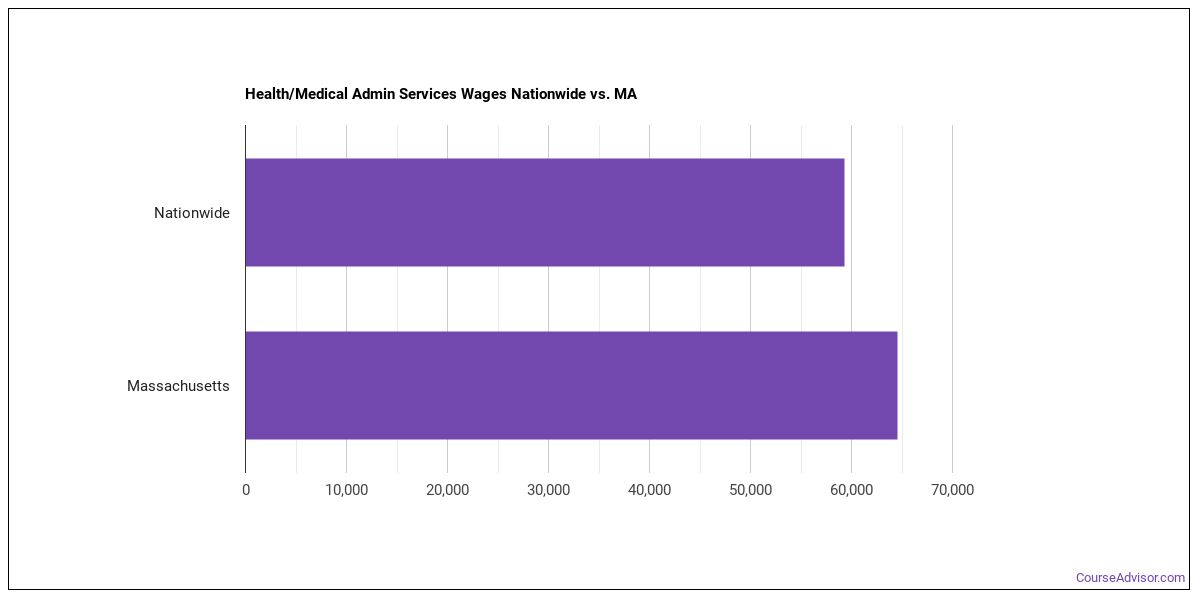
Wages for Health & Medical Administrative Services Jobs in Massachusetts
Health & Medical Administrative Services grads earn an average of $64,560 in the state and $59,340 nationwide.
Most Popular Health & Medical Administrative Services Programs in MA
There are 11 colleges in Massachusetts that offer health & medical administrative services degrees. Learn about the most popular 11 below:

Most students complete their degree in 4.24 years. 29% of the teachers are full time. The student to faculty ratio is 10 to 1.
Request Information
Students who attend this private institution pay an average net price of $28,521. Students enjoy a student to faculty ratio of 16 to 1. Of all the teachers who work at the school, 56% are considered full time.
Request Information
Seeking financial aid? At this school, 53% of students receive it. Students who attend this private institution pay an average net price of $27,779. The full-time teacher rate is 70%.
Request Information
The student to faculty ratio is 12 to 1. Of all the students who attend this school, 68% get financial aid. 100% of the teachers are full time.
Request Information
17 to 1 is the student to faculty ratio. It takes the average student 4.45 years to graduate. This public school has an average net price of $18,281.
Request Information
Of all the teachers who work at the school, 99% are considered full time. Students who attend this public school pay an average net price of $18,359. 99% of students get financical aid.
Request Information12% of the teachers are full time. Students enjoy a student to faculty ratio of 16 to 1.
Request Information
Students enjoy a student to faculty ratio of 7 to 1. Students who attend this private institution pay an average net price of $19,500. It takes the average student 4.15 years to graduate.
Request Information
Of all the teachers who work at the school, 15% are considered full time. It takes the average student 4.12 years to graduate. Students enjoy a student to faculty ratio of 11 to 1.
Request Information
8 to 1 is the student to faculty ratio. Students who attend this private institution pay an average net price of $21,178. 100% of students get financical aid.
Request Information
Students enjoy a student to faculty ratio of 11 to 1. This private school has an average net price of $25,829. The full-time teacher rate is 23%.
Request InformationHealth & Medical Administrative Services Careers in MA
Some of the careers health & medical administrative services majors go into include:
| Job Title | MA Job Growth | MA Median Salary |
|---|---|---|
| Medical and Health Services Managers | 16% | $113,690 |
| Medical Secretaries | 13% | $42,070 |
| Administrative Services Managers | 9% | $101,250 |
| Office and Administrative Support Worker Supervisors | 2% | $61,510 |
| Claims Adjusters, Examiners, and Investigators | -2% | $75,250 |
| Medical Transcriptionists | -12% | $35,610 |
Related Majors in Massachusetts
Below are some popular majors in the state that are similar to health & medical administrative services.
| Major | Annual Graduates in MA |
|---|---|
| Nursing | 6,626 |
| Public Health | 1,567 |
| Pharmacy/Pharmaceutical Sciences | 1,457 |
| Rehabilitation Professions | 1,434 |
| Allied Health Professions | 1,125 |
| Mental & Social Health Services | 829 |
| Health Sciences & Services | 789 |
| Medicine | 692 |
View all majors related to Health & Medical Administrative Services
Explore Major by State
Alabama
Arkansas
Connecticut
Florida
Idaho
Iowa
Louisiana
Massachusetts
Mississippi
Nebraska
New Jersey
North Carolina
Oklahoma
Rhode Island
Tennessee
Vermont
West Virginia
View Nationwide Health & Medical Administrative Services Report
References
More about our data sources and methodologies.
Course Advisor provides higher-education, college and university, degree, program, career, salary, and other helpful information to students, faculty, institutions, and other internet audiences. Presented information and data are subject to change. Inclusion on this website does not imply or represent a direct relationship with the company, school, or brand. Information, though believed correct at time of publication, may not be correct, and no warranty is provided. Contact the schools to verify any information before relying on it. Financial aid may be available for those who qualify. The displayed options may include sponsored or recommended results, not necessarily based on your preferences.
© Course Advisor – All Rights Reserved.