Fisher College Science & Tech Programs
Fisher College is a private not-for-profit institution located in Boston, MA. A Major City Center offers tranquility and safety close to urban amenities.
Featured schools near , edit
Fisher College Rankings
Fisher College is featured in these rankings for science & tech programs at the bachelors level:
| Ranking | Rank | Among |
|---|---|---|
| Overall Quality | #142 of 254 | Region — New England |
| Overall Quality | #2032 of 4,630 | Nationwide |
Where Is Fisher College?
Contact details for Fisher College are listed below.
| Contact Details | |
|---|---|
| Address: | 118 Beacon Street, Boston, MA 02116 |
| Phone: | 6172368800 |
| Website: | www.fisher.edu/ |
| Admissions: | www.fisher.edu/admissions-aid |
| Financial Aid: | www.fisher.edu/admissions-aid/financial-aid |
How Do I Get Into Fisher College?
You can apply to Fisher College online at: https://apply.fisher.edu/apply/
Fisher College is classified as Less Selective (70-85%) for admissions.
Admission Requirements for Fisher College
These are the things Fisher College looks for in applicants:
| Requirement | Status |
|---|---|
| Secondary School Record | Required |
| Secondary School GPA | Required |
| Recommendations | Neither required nor recommended |
| Admission Test Scores (SAT/ACT) | Neither required nor recommended |
How Hard Is It To Get Into Fisher College?
Fisher College admits 71%, making it fairly accessible. Be sure to prepare a complete application and prepare the application in full.
Of those admitted, 6% choose to enroll — a modest enrollment yield, suggesting many admitted students choose other institutions.
Average Test Scores
Selectivity by Gender
Selectivity numbers at Fisher College can differ by gender.
| Gender | Applicants | Admitted | Acceptance Rate |
|---|---|---|---|
| Men | 1,444 | 952 | 66% |
| Women | 2,053 | 1,541 | 75% |
Can I Afford Fisher College?
The average net price after aid at Fisher College is $25,702. Cost varies significantly based on your financial situation since net price varies by income group.
Tuition & Fees
| Category | Cost |
|---|---|
| In-State Tuition | $34,489 |
| In-State Fees | $1,200 |
| Out-of-State Tuition | $34,489 |
| Out-of-State Fees | $1,200 |
| Total In-State Tuition & Fees | $35,689 |
| Total Out-of-State Tuition & Fees | $35,689 |
Financial Aid
Counting all forms of financial assistance, 15% of students at Fisher College receive some form of financial aid (205 students).
Approximately 73% of students at Fisher College receive grant or scholarship aid, averaging $17,718 per student.
40% of students receive federal Pell Grants, averaging $6,261.
Student Loan Debt
61% of Fisher College undergraduates take out federal student loans, averaging $5,090 per year.
Fisher College Undergraduate Student Diversity
There are 182 students enrolled at Fisher College. Fisher College is classified as a 1,000 - 4,999 institution by enrollment size. Its Carnegie Classification is Baccalaureate Colleges: Diverse Fields.
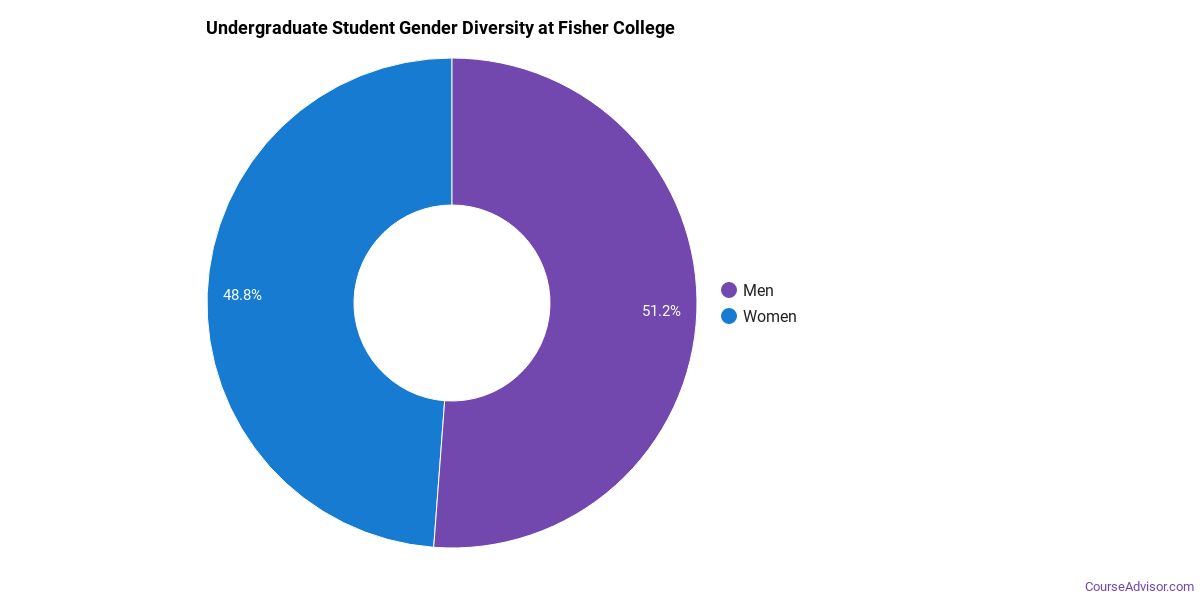
Gender Diversity
Of the 1,138 undergraduate students at Fisher College, approximately 38% are male and 62% are female.
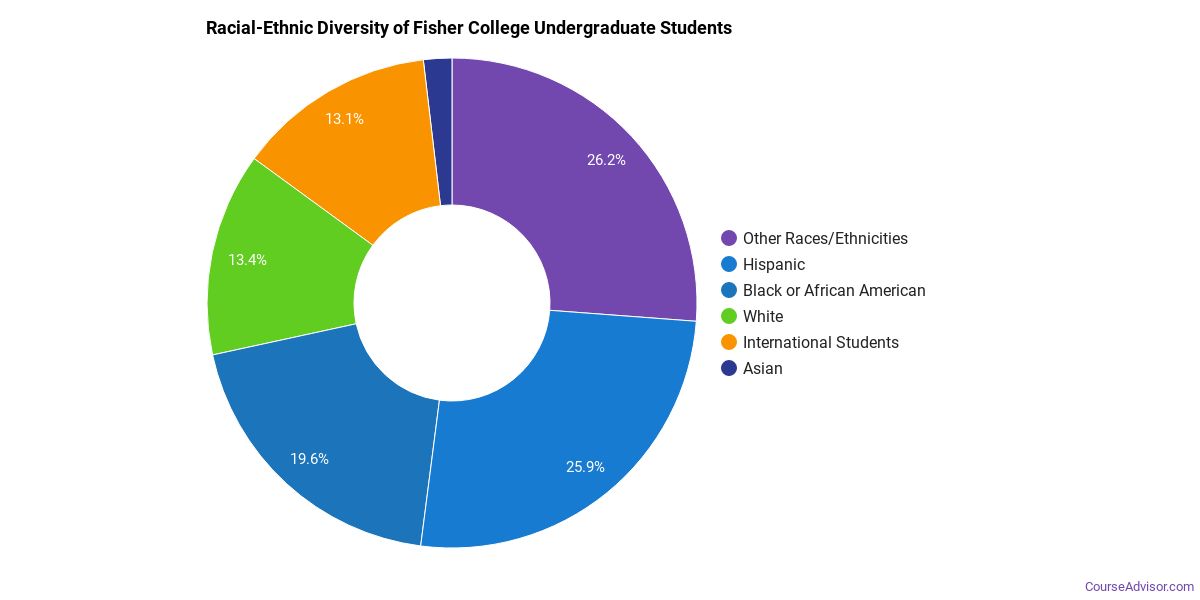
Racial-Ethnic Diversity
The racial-ethnic breakdown of Fisher College undergraduate students is as follows.
| Race/Ethnicity | Number of Students |
|---|---|
| Asian | 21 |
| Black or African American | 116 |
| Hispanic | 194 |
| White | 234 |
| American Indian/Alaska Native | 1 |
| Native Hawaiian/Pacific Islander | 1 |
| Two or More Races | 26 |
| Non-Resident | 106 |
Geographic Diversity
The top 5 home states of first-time undergraduate students at Fisher College are shown below.

| State | First-Time UG Students |
|---|---|
| Massachusetts | 89 |
| Connecticut | 3 |
| Florida | 3 |
| New Hampshire | 3 |
| New Jersey | 2 |
Additionally, approximately 9.4% of undergraduate students are non-resident from outside the United States.
Fisher College Graduate Student Diversity
117 of Fisher College’s students are in graduate programs. The highest graduate-level award offered is Master’s degree.
Gender Diversity (Graduate)
Among graduate students at Fisher College, approximately 45% are male and 55% are female.

Racial-Ethnic Diversity (Graduate)
The racial-ethnic breakdown of Fisher College graduate students is as follows.

| Race/Ethnicity | Number of Students |
|---|---|
| Asian | 1 |
| Black or African American | 13 |
| Hispanic | 12 |
| White | 38 |
| Two or More Races | 3 |
| Non-Resident | 20 |
Online Learning at Fisher College
Fisher College offers remote learning paths for students who need flexibility.
167 undergraduate students at Fisher College took at least one online class — of those, 918 took all of their classes online.
At the graduate level, 8 students took at least one online class and 47 took all classes online. Distance education is available at the undergraduate and graduate levels.
Academic Programs at Fisher College
Fisher College offers 13 distinct academic programs.
The highest level of award offered is Master’s degree.
Institutional Profile
Fisher College maintains an open admission policy: No. Credit transfer:
- AP credits: Yes
- Dual enrollment credits: Yes
- Life experience credits: Implied no
References
More about our data sources and methodologies.
Course Advisor provides higher-education, college and university, degree, program, career, salary, and other helpful information to students, faculty, institutions, and other internet audiences. Presented information and data are subject to change. Inclusion on this website does not imply or represent a direct relationship with the company, school, or brand. Information, though believed correct at time of publication, may not be correct, and no warranty is provided. Contact the schools to verify any information before relying on it. Financial aid may be available for those who qualify. The displayed options may include sponsored or recommended results, not necessarily based on your preferences.
© Course Advisor – All Rights Reserved.