Education Undergraduate Certificates
There are 2,227 colleges and universities across the nation that offer aundergraduate certificate in Education. In recent years, the majority of students earning degrees in this area were women, and about44% were students from underrepresented racial-ethnic groups. Also, 0.8% of Education graduates were international students.
Featured schools near , edit
Education Levels of Education Majors
In the most recent reporting year, 317,436 students earned theirEducation majors across all award levels. The following table shows the number of diplomas awarded in Education at each degree level.
| Education Level | Number of Grads |
|---|---|
| Certificate (this page) | 4,789 |
| Associate’s Degree | 17,944 |
| Bachelor’s Degree | 92,051 |
| Master’s Degree | 183,805 |
| Doctor’s Degree | 16,277 |

Earnings of Education Majors With Undergraduate Certificates (All Award Levels)
The U.S. Department of Education reports a median salary for graduates with aundergraduate certificate in Education of $52,563 four years after graduation. These figures are reported program-wide, across all award levels.
However, this can depend on a number of factors, such as where you live and the number of years of experience you have.
| Years After Graduation | Median Earnings |
|---|---|
| 1 year | $53,304 |
| 4 years | $52,563 |
| 5 years | $58,393 |
Source: U.S. Department of Education College Scorecard, field-of-study earnings tracker (program-wide, all award levels).
Student Debt (All Award Levels)
We do not have the data to estimate the median debt for graduates with this degree.
Student Diversity
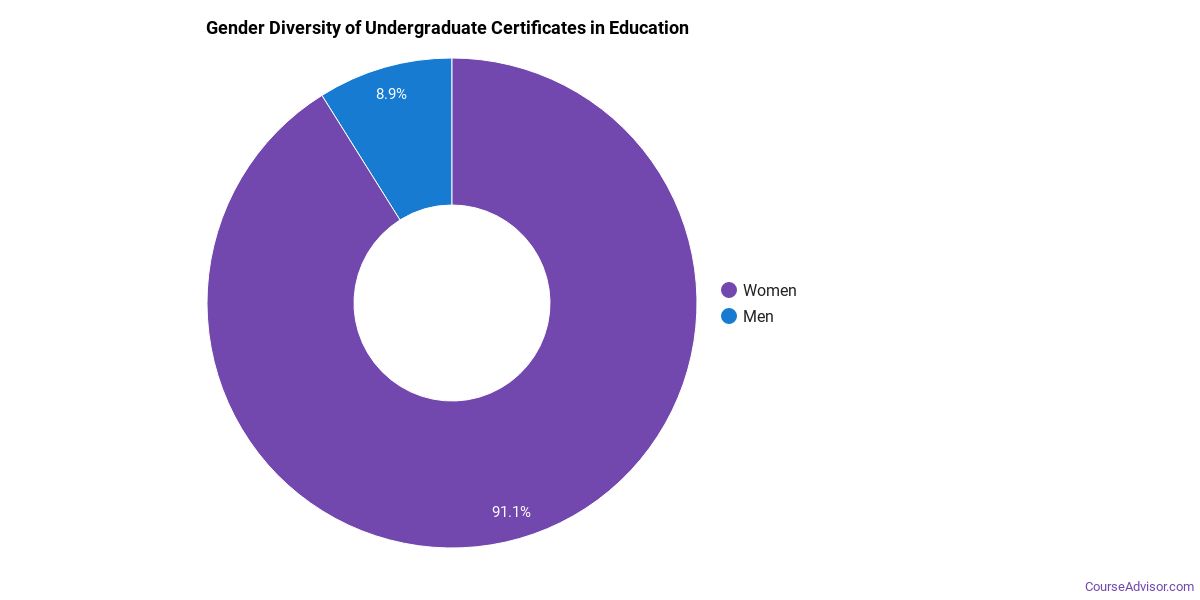
More women than men pursue their undergraduate certificate in Education. About 89.5% of graduates with this degree are women.
| Gender | Number of Grads |
|---|---|
| Men | 503 |
| Women | 4,286 |
The racial-ethnic distribution of Education graduates is as follows:
| Race / Ethnicity | Number of Grads | Share |
|---|---|---|
| White | 2,655 | 55.4% |
| Asian | 163 | 3.4% |
| Hispanic or Latino | 931 | 19.4% |
| Black or African American | 549 | 11.5% |
| American Indian / Alaska Native | 99 | 2.1% |
| Native Hawaiian / Pacific Islander | 56 | 1.2% |
| Two or More Races | 139 | 2.9% |
| Race Unknown | 161 | 3.4% |
| International Students | 36 | 0.8% |
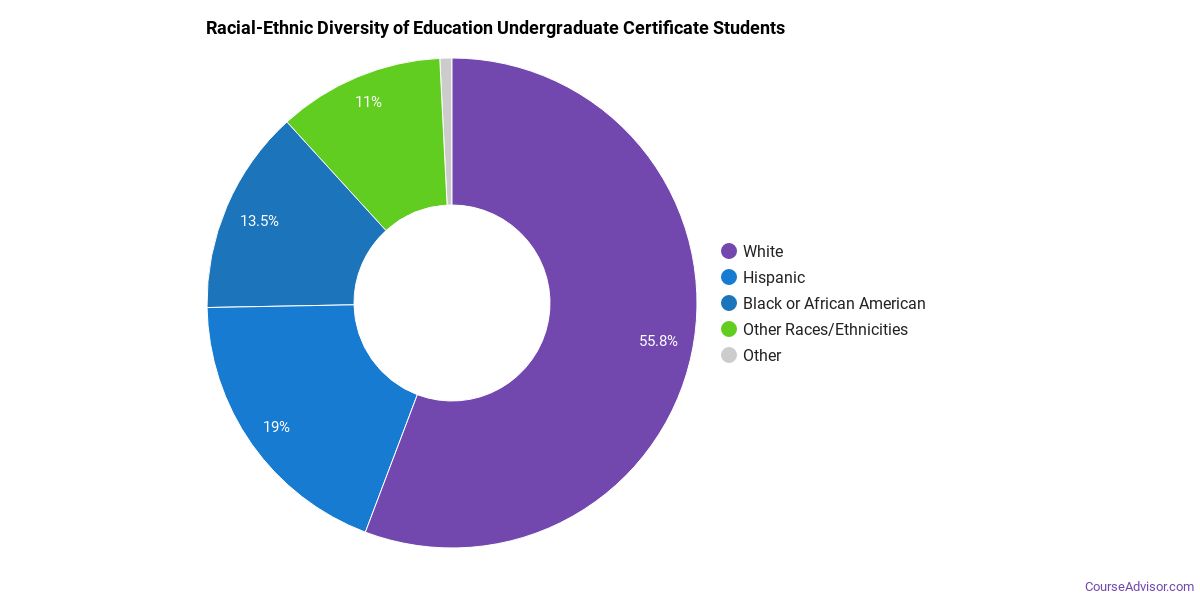
This degree is not very popular with international students. Only 0.8% of graduates fall into this category.
See the minority definition in the References below.
Most Popular Education Programs for Undergraduate Certificates
There are 2,392 colleges that offer a undergraduate certificate in Education. Learn more about the most popular below:

The most popular school in the United States for Education students seeking a undergraduate certificate is Western Governors University. During the most recent year for which we have data, 16,762 people received their undergraduate certificate in Education from this school. Data shows that graduates who hold this degree go on to make a median salary of $40,669.
Grand Canyon University is a popular choice for Education majors seeking their undergraduate certificate. This school awarded 8,040 undergraduate certificates in Education in the most recent reporting year. Graduates who complete their undergraduate certificate in Education here go on to a median salary of $40,669.
American College of Education comes in at #3 on our list of the most popular colleges offering undergraduate certificates in Education. This school awarded 5,830 undergraduate certificates in Education in the most recent reporting year. Data shows that graduates who hold this degree go on to make a median salary of $40,669.
Liberty University comes in at #4 on our list of the most popular colleges offering undergraduate certificates in Education. This school awarded 4,083 undergraduate certificates in Education in the most recent reporting year. Data shows that graduates who hold this degree go on to make a median salary of $40,669.
Arizona State University Digital Immersion comes in at #5 on our list of the most popular colleges offering undergraduate certificates in Education. This school awarded 2,516 undergraduate certificates in Education in the most recent reporting year. Graduates who complete their undergraduate certificate in Education here go on to a median salary of $40,669.
Ball State University is a popular choice for Education majors seeking their undergraduate certificate. During the most recent year for which we have data, 2,395 people received their undergraduate certificate in Education from this school. Data shows that graduates who hold this degree go on to make a median salary of $40,669.
Lamar University comes in at #7 on our list of the most popular colleges offering undergraduate certificates in Education. During the most recent year for which we have data, 1,909 people received their undergraduate certificate in Education from this school. Data shows that graduates who hold this degree go on to make a median salary of $40,669.
University of the Cumberlands is a popular choice for Education majors seeking their undergraduate certificate. During the most recent year for which we have data, 1,903 people received their undergraduate certificate in Education from this school. Data shows that graduates who hold this degree go on to make a median salary of $40,669.
Walden University is a popular choice for Education majors seeking their undergraduate certificate. During the most recent year for which we have data, 1,811 people received their undergraduate certificate in Education from this school. Data shows that graduates who hold this degree go on to make a median salary of $40,669.
National University is a popular choice for Education majors seeking their undergraduate certificate. During the most recent year for which we have data, 1,669 people received their undergraduate certificate in Education from this school. Graduates who complete their undergraduate certificate in Education here go on to a median salary of $40,669.
Arkansas State University comes in at #11 on our list of the most popular colleges offering undergraduate certificates in Education. This school awarded 1,661 undergraduate certificates in Education in the most recent reporting year. Graduates who complete their undergraduate certificate in Education here go on to a median salary of $40,669.
University of West Georgia is a popular choice for Education majors seeking their undergraduate certificate. This school awarded 1,592 undergraduate certificates in Education in the most recent reporting year. Graduates who complete their undergraduate certificate in Education here go on to a median salary of $40,669.
University of Phoenix-Arizona is a popular choice for Education majors seeking their undergraduate certificate. This school awarded 1,229 undergraduate certificates in Education in the most recent reporting year. Graduates who complete their undergraduate certificate in Education here go on to a median salary of $40,669.
Ivy Tech Community College comes in at #14 on our list of the most popular colleges offering undergraduate certificates in Education. This school awarded 1,218 undergraduate certificates in Education in the most recent reporting year. Data shows that graduates who hold this degree go on to make a median salary of $40,669.
Northwest Missouri State University is a popular choice for Education majors seeking their undergraduate certificate. This school awarded 1,173 undergraduate certificates in Education in the most recent reporting year. Data shows that graduates who hold this degree go on to make a median salary of $40,669.
University of West Alabama comes in at #16 on our list of the most popular colleges offering undergraduate certificates in Education. This school awarded 1,142 undergraduate certificates in Education in the most recent reporting year. Graduates who complete their undergraduate certificate in Education here go on to a median salary of $40,669.
National Louis University comes in at #17 on our list of the most popular colleges offering undergraduate certificates in Education. During the most recent year for which we have data, 1,130 people received their undergraduate certificate in Education from this school. Graduates who complete their undergraduate certificate in Education here go on to a median salary of $40,669.
Ashford University is a popular choice for Education majors seeking their undergraduate certificate. This school awarded 1,094 undergraduate certificates in Education in the most recent reporting year. Graduates who complete their undergraduate certificate in Education here go on to a median salary of $40,669.
University of Central Florida comes in at #19 on our list of the most popular colleges offering undergraduate certificates in Education. This school awarded 1,080 undergraduate certificates in Education in the most recent reporting year. Data shows that graduates who hold this degree go on to make a median salary of $40,669.
University of Nevada-Las Vegas is a popular choice for Education majors seeking their undergraduate certificate. During the most recent year for which we have data, 1,056 people received their undergraduate certificate in Education from this school. Graduates who complete their undergraduate certificate in Education here go on to a median salary of $40,669.
Education Majors to Study
| Major | Annual Degrees Awarded |
|---|---|
| Teacher Education and Professional Development, Specific Levels and Methods | 108,054 |
| Educational Administration and Supervision | 42,255 |
| Teacher Education and Professional Development, Specific Subject Areas | 39,881 |
| Special Education and Teaching | 33,988 |
| Education, General | 27,481 |
Explore Education by State
Alabama
California
District of Columbia
Idaho
Kansas
Maryland
Mississippi
Nevada
New York
Oklahoma
South Carolina
Utah
West Virginia
Alaska
Colorado
Florida
Illinois
Kentucky
Massachusetts
Missouri
New Hampshire
North Carolina
Oregon
South Dakota
Vermont
Wisconsin
References
The racial-ethnic minority student count is calculated by taking the total number of students and subtracting white students, international students, and students whose race/ethnicity was unknown. This number is then divided by the total number of students to obtain the percentage of racial-ethnic minorities.
- College Factual
- National Center for Education Statistics (IPEDS)
- O*NET Online
- U.S. Bureau of Labor Statistics
- U.S. Department of Education College Scorecard
More about our data sources and methodologies.
Course Advisor provides higher-education, college and university, degree, program, career, salary, and other helpful information to students, faculty, institutions, and other internet audiences. Presented information and data are subject to change. Inclusion on this website does not imply or represent a direct relationship with the company, school, or brand. Information, though believed correct at time of publication, may not be correct, and no warranty is provided. Contact the schools to verify any information before relying on it. Financial aid may be available for those who qualify. The displayed options may include sponsored or recommended results, not necessarily based on your preferences.
© Course Advisor – All Rights Reserved.