Computer Science at Villanova University
If you plan to study Computer Science, consider the program at Villanova University. Get started with the following essential facts.
Villanova University sits in Villanova, PA.
In the most recent year for which we have data, 70 computer science graduations were recorded at Villanova University.
Featured schools near , edit
Online Class Availability at Villanova University
Distance learning is available at Villanova University. Among 10,041 students, 1,069 (11%) were enrolled entirely in distance education and 1,768 (18%) took at least some classes online.
Computer Science Rankings at Villanova University
These rankings give you a sense of how Villanova University’s Computer Science program against peer institutions.
Bachelor’s-Level Rankings
| Ranking | Scope | Rank |
|---|---|---|
| Best Schools (Quality) | Pennsylvania | #5 of 32 |
| Best Schools (Quality) | Middle Atlantic (Region) | #15 of 112 |
| Best Value | Pennsylvania | #32 of 32 |
| Best Schools (Quality) | Nationwide | #61 of 637 |
| Best Value | Middle Atlantic (Region) | #110 of 111 |
| Best Value | Nationwide | #631 of 635 |
Master’s-Level Rankings
| Ranking | Scope | Rank |
|---|---|---|
| Best Schools (Quality) | Pennsylvania | #5 of 32 |
| Best Schools (Quality) | Middle Atlantic (Region) | #15 of 112 |
| Best Value | Pennsylvania | #32 of 32 |
| Best Schools (Quality) | Nationwide | #61 of 637 |
| Best Value | Middle Atlantic (Region) | #110 of 111 |
| Best Value | Nationwide | #631 of 635 |
Student Demographics & Diversity
Below you’ll find the composition of Computer Science graduates at Villanova University, by degree type.
Looking at the program as a whole, Computer Science graduates at Villanova University are 36% women (25) and 64% men (45).
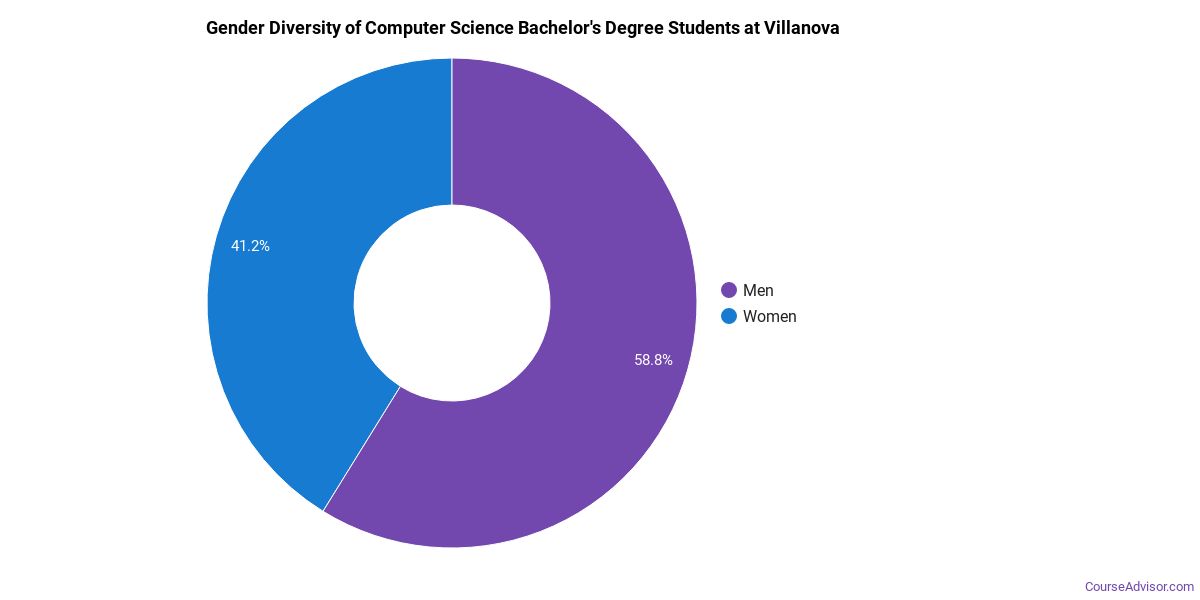
Computer Science Bachelor’s Program at Villanova University
Of the 43 bachelor’s computer science graduates at Villanova University, 28% were women (12) and 72% were men (31).
The following table and chart show the race/ethnicity of Computer Science bachelor’s degree recipients at Villanova University.
| Race / Ethnicity | Number of Graduates |
|---|---|
| White | 25 |
| Hispanic / Latino | 6 |
| Black / African American | 4 |
| Asian | 4 |
| Two or More Races | 1 |
| International (Nonresident) | 3 |
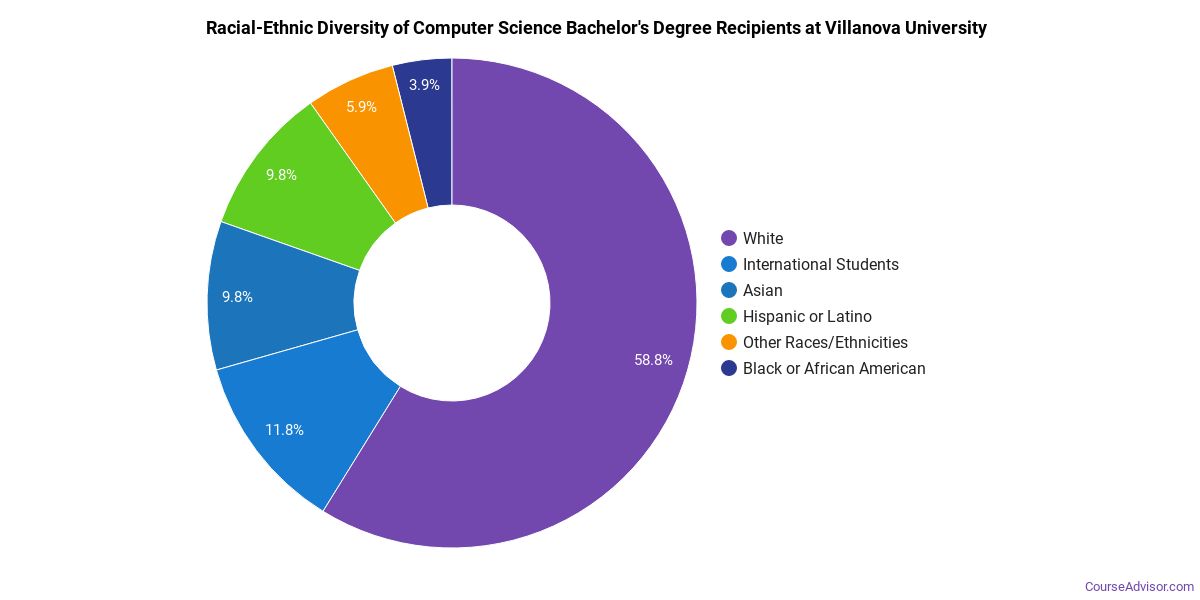
Racial-ethnic minorities make up 35% of Computer Science bachelor’s degree recipients at Villanova University, below the national average of 47%.*
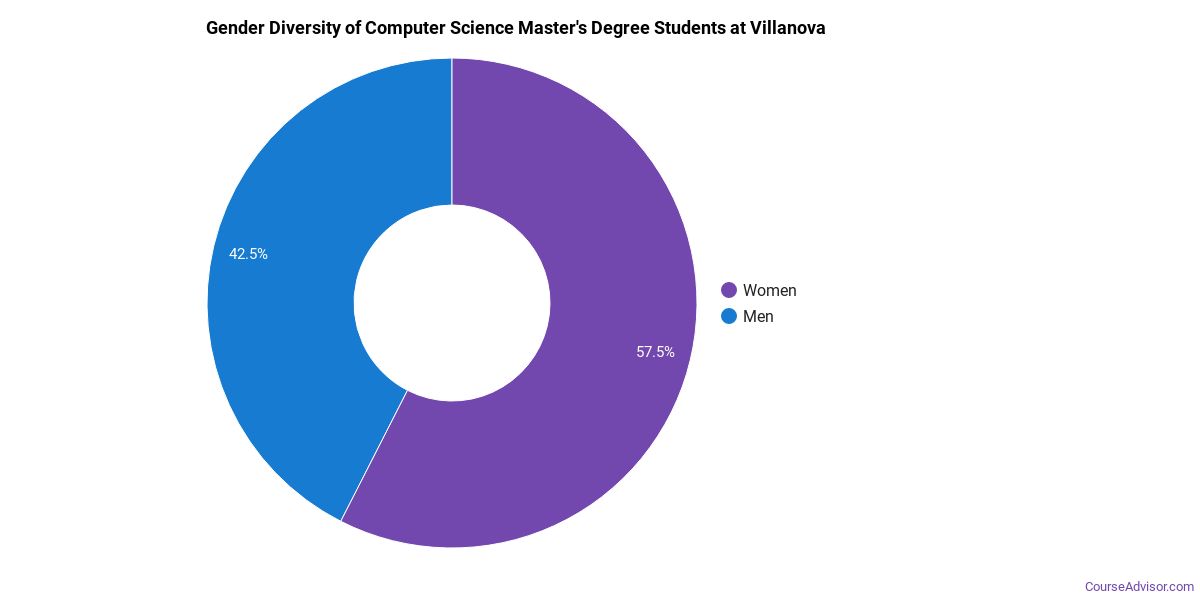
Computer Science Master’s Program at Villanova University
Of the 27 master’s computer science graduates at Villanova University, 48% were women (13) and 52% were men (14).
The following table and chart show the race/ethnicity of Computer Science master’s degree recipients at Villanova University.
| Race / Ethnicity | Number of Graduates |
|---|---|
| White | 1 |
| Asian | 2 |
| International (Nonresident) | 24 |
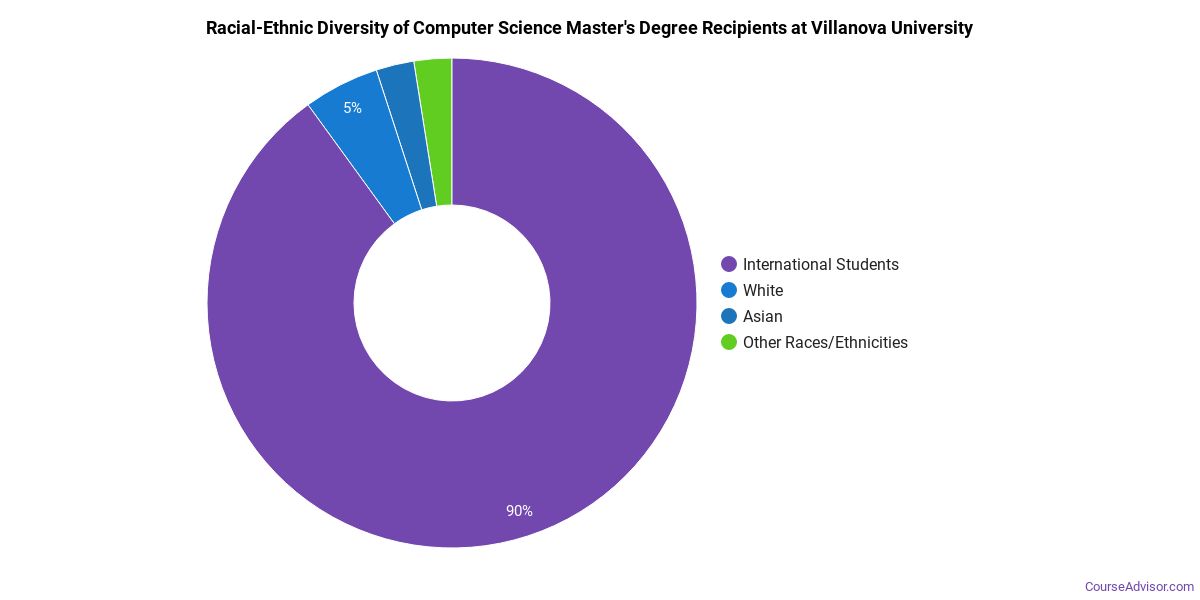
Minority students account for 7% of Computer Science master’s degree recipients at Villanova University, below the national average of 12%.*
*The racial-ethnic minorities figure is the total number of graduates minus White, international (nonresident), and unknown-race graduates.
More Specific Computer Science Concentrations at Villanova University
The Computer Science program at Villanova University includes the following sub-specializations:
| Concentration | Graduates |
|---|---|
| General Computer Science | 70 |
Top-Paying Careers for Computer Science Graduates
Graduates of the Computer Science program at Villanova University work across a variety of fields. Here are the best-paid careers for Computer Science majors, ordered by median annual salary:
| Occupation | Nationwide Median Wage |
|---|---|
| Computer and Information Systems Managers | $175,079 |
| Computer Occupations, All Other | $159,837 |
| Database Architects | $148,480 |
| Document Management Specialists | $147,490 |
| Business Intelligence Analysts | $143,840 |
| Information Security Engineers | $142,543 |
| Computer Systems Engineers/Architects | $140,795 |
| Web Developers | $125,527 |
| Information Technology Project Managers | $124,655 |
| Blockchain Engineers | $123,667 |
References
- IPEDS — Integrated Postsecondary Education Data System
- U.S. Department of Education — College Scorecard
- O*NET Online (Bureau of Labor Statistics)
- National Center for Education Statistics
More about our data sources and methodologies.
Course Advisor provides higher-education, college and university, degree, program, career, salary, and other helpful information to students, faculty, institutions, and other internet audiences. Presented information and data are subject to change. Inclusion on this website does not imply or represent a direct relationship with the company, school, or brand. Information, though believed correct at time of publication, may not be correct, and no warranty is provided. Contact the schools to verify any information before relying on it. Financial aid may be available for those who qualify. The displayed options may include sponsored or recommended results, not necessarily based on your preferences.
© Course Advisor – All Rights Reserved.