Verified & Claimed College
About Villanova University
The only Augustinian Catholic university in the nation, Villanova values a personalized experience where teachers and students are partners in learning and scholarly inquiry. From undergraduate to doctoral students, Villanovans are intellectually inspired, morally grounded, globally minded. Villanova attracts and forges world changers—people who ignite positive change everywhere life takes them.
VIRTUAL VISIT
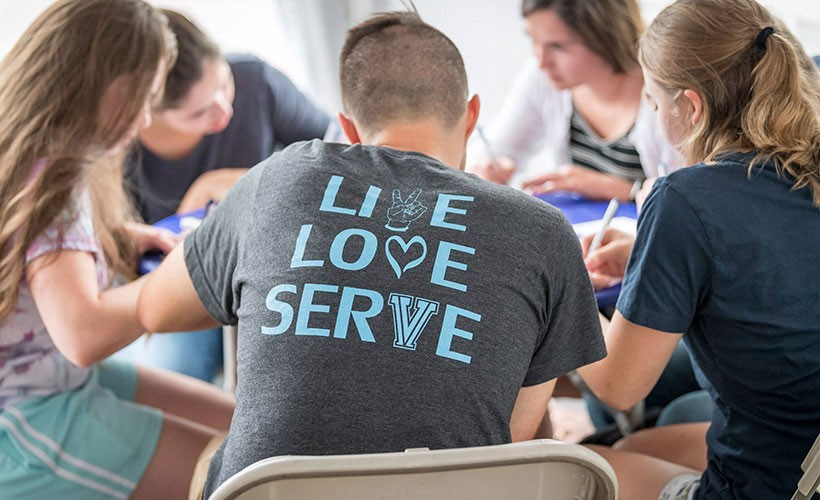
MISSION & MINISTRY
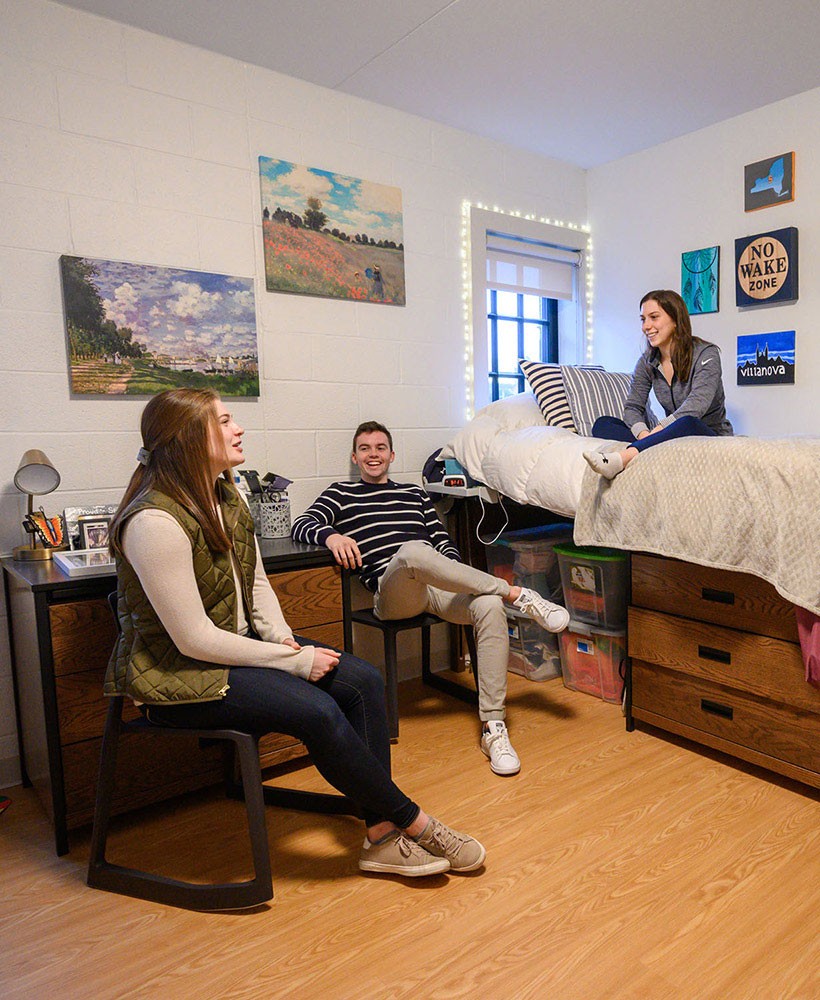
STUDENT LIFE
ALUMNI NETWORK

SUMMER SESSIONS

Villanova Academics
Villanova University is a closely connected academic community with renowned faculty, rich resources and a personalized, supportive learning environment.
Villanova provides exceptional opportunities for a wide range of academic experiences, including hands-on research, interdisciplinary collaboration and experiential learning.
Online & Hybrid Progams
Villanova University’s College of Profession Studies offers a variety of pathways to enrich your life, enhance your value in the workplace and pursue new careers.
• Bootcamp programs to fast-track your learning
• Online Bachelors in Leadership, Public Services and Administration, Organizational Development and Management and General Studies

What is a Villanovan?
AThere are so many ways to describe a Villanovan. THIS Villanova University COMMERCIAL does it in 30 seconds. Ignite Change. Go Nova.
Visit villanova.edu/whatisavillanovan for the full story.
Villanova University Overview
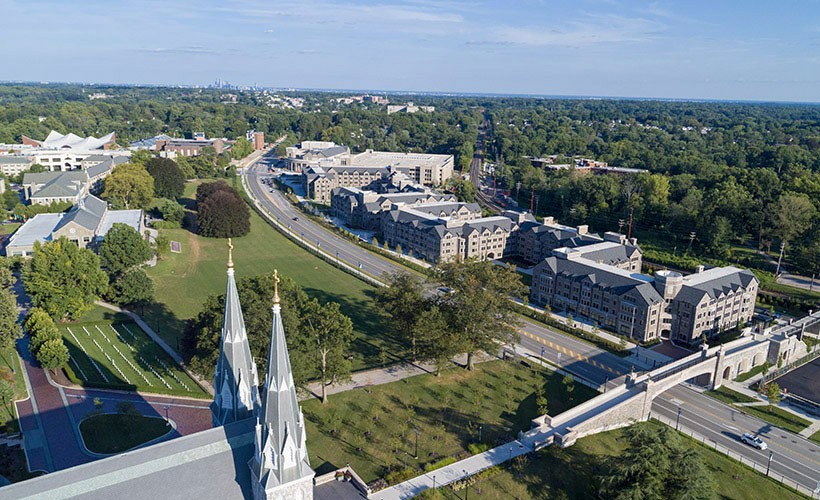
Villanova University is a private not-for-profit institution situated in Villanova, Pennsylvania. The suburban atmosphere of Villanova makes it a great place for students who want the amenities of city life without actually living in the middle of a constant hustle and bustle.
What Is Villanova University Known For?
- Students who want to work more closely with their professors have an easier time at Villanova since the student to facuty ratio is 10 to 1.
- Although it may not be available for every major, the doctor's degree is the highest award a student can attain at Villanova.
- During a recent academic cycle, 67% of the faculty were full-time.
- Students who graduate from Villanova with a bachelor's degree make about $100,423 a year. That's 146% more than those who graduate from other schools.
- It takes the average Villanova student 4.0 years to graduate. This is pretty good when compared to the national rate of 4.4 years.
Where Is Villanova University?
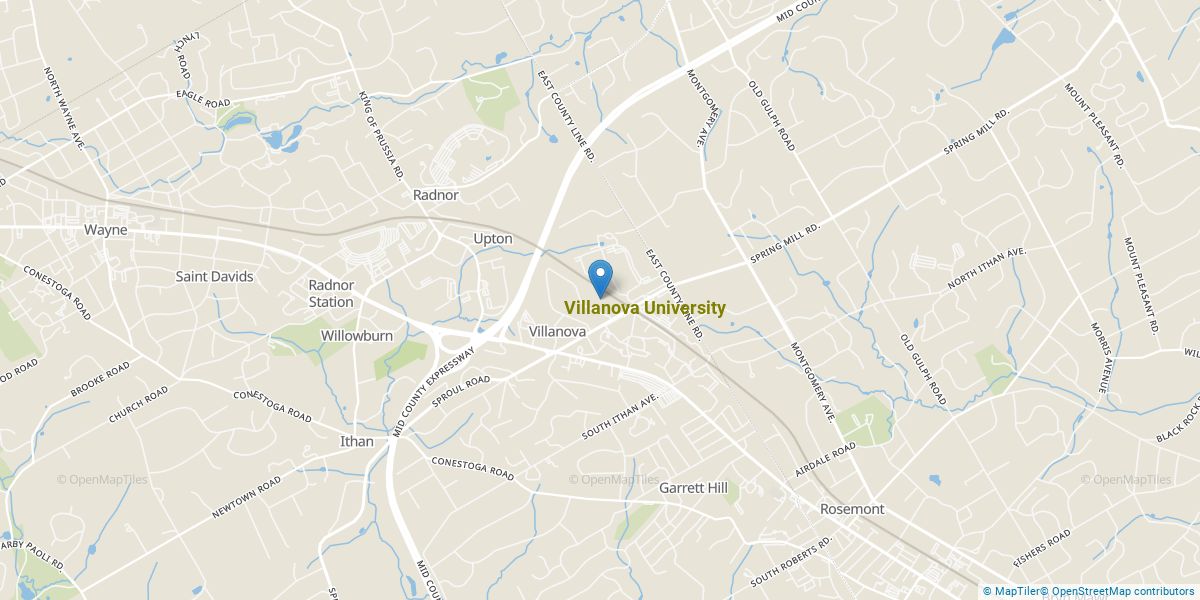
Contact details for Villanova are given below.
| Contact Details | |
|---|---|
| Address: | 800 Lancaster Avenue, Villanova, PA 19085-1699 |
| Phone: | 610-519-4500 |
| Website: | www.villanova.edu |
How Do I Get Into Villanova?
You can apply to Villanova online at: www1.villanova.edu/university/apply.html
Admission Requirements for Villanova
| Submission | Required? |
|---|---|
| High School GPA | 1 |
| High School Rank | 5 |
| High School Transcript | 1 |
| College Prep Program | 1 |
| Recommendations | 1 |
| SAT or ACT Scores | 5 |
| TOEFL | 1 |
How Hard Is It To Get Into Villanova?
Approximately 50% of accepted students are men and 50% are women. The acceptance rate for men is 26%, and the acceptance rate for women is 22%.
Average Test Scores
About 28% of students accepted to Villanova submitted their SAT scores. When looking at the 25th through the 75th percentile, SAT Evidence-Based Reading and Writing scores ranged between 678 and 730. Math scores were between 700 and 770.
Can I Afford Villanova University?
The net price is calculated by adding tuition, room, board and other costs and subtracting financial aid.
Student Loan Debt
Almost 66% of college students who graduated with the class of 2018 took out student loans, but that percentage varies from school to school. At Villanova, approximately 40% of students took out student loans averaging $10,781 a year. That adds up to $43,124 over four years for those students.
Explore Best Ranked Schools for You
Villanova University Undergraduate Student Diversity
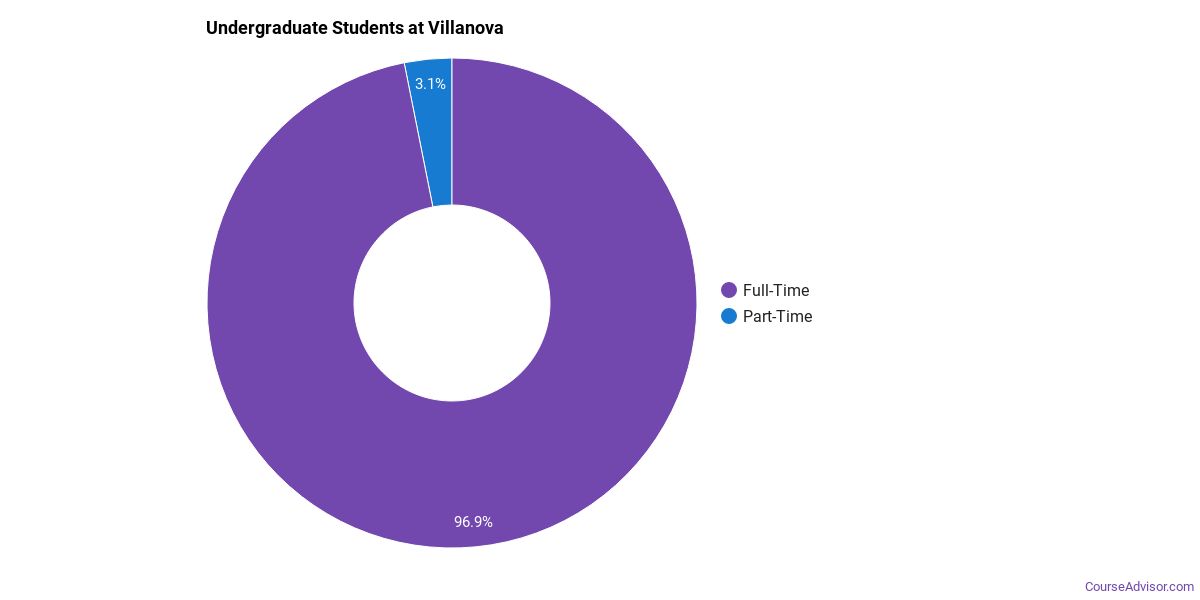
There are also 3,995 graduate students at the school.
Gender Diversity
Of the 6,793 full-time undergraduates at Villanova, 47% are male and 53% are female.

Racial-Ethnic Diversity
The racial-ethnic breakdown of Villanova University students is as follows.

| Race/Ethnicity | Number of Grads |
|---|---|
| Asian | 436 |
| Black or African American | 317 |
| Hispanic or Latino | 628 |
| White | 4,951 |
| International Students | 170 |
| Other Races/Ethnicities | 291 |
Geographic Diversity
Pennsylvania students aren't the only ones who study at Villanova University. At this time, 42 states are represented by the student population at the school.
Over 72 countries are represented at Villanova. The most popular countries sending students to the school are India, China, and Vietnam.
Villanova University Undergraduate Concentrations
The table below shows the number of awards for each concentration.
References
*The racial-ethnic minorities count is calculated by taking the total number of students and subtracting white students, international students, and students whose race/ethnicity was unknown. This number is then divided by the total number of students at the school to obtain the racial-ethnic minorities percentage.
- College Factual
- National Center for Education Statistics
- Image Credit: By Alertjean under License
More about our data sources and methodologies.
Course Advisor provides higher-education, college and university, degree, program, career, salary, and other helpful information to students, faculty, institutions, and other internet audiences. Presented information and data are subject to change. Inclusion on this website does not imply or represent a direct relationship with the company, school, or brand. Information, though believed correct at time of publication, may not be correct, and no warranty is provided. Contact the schools to verify any information before relying on it. Financial aid may be available for those who qualify. The displayed options may include sponsored or recommended results, not necessarily based on your preferences.
© Course Advisor – All Rights Reserved.