Mechanical Engineering at Villanova University
What traits are you looking for in a school for Mechanical Engineering, consider the program at Villanova University. We’ve gathered the following information to help you decide.
Villanova University is located in Villanova, PA.
During the most recent reporting year, 100 mechanical engineering degrees were awarded at Villanova University.
Featured schools near , edit
Online Class Availability at Villanova University
Many students take online classes at Villanova University. Of 10,041 students, 1,069 (11%) studied exclusively online and 1,768 (18%) took at least some classes online.
Mechanical Engineering Rankings at Villanova University
These rankings give you a sense of how Villanova University’s Mechanical Engineering program against peer institutions.
Bachelor’s-Level Rankings
| Ranking | Scope | Rank |
|---|---|---|
| Best Schools (Quality) | Pennsylvania | #5 of 24 |
| Best Schools (Quality) | Middle Atlantic (Region) | #9 of 61 |
| Best Value | Pennsylvania | #24 of 24 |
| Best Schools (Quality) | Nationwide | #43 of 365 |
| Best Value | Middle Atlantic (Region) | #60 of 61 |
| Best Value | Nationwide | #360 of 364 |
Master’s-Level Rankings
| Ranking | Scope | Rank |
|---|---|---|
| Best Schools (Quality) | Pennsylvania | #5 of 24 |
| Best Schools (Quality) | Middle Atlantic (Region) | #9 of 61 |
| Best Value | Pennsylvania | #24 of 24 |
| Best Schools (Quality) | Nationwide | #43 of 365 |
| Best Value | Middle Atlantic (Region) | #60 of 61 |
| Best Value | Nationwide | #360 of 364 |
Earnings for Mechanical Engineering Graduates from Villanova University
Those who finish Villanova University’s Mechanical Engineering program earn the following amounts (per the U.S. Department of Education’s College Scorecard):
| Years After Graduation | Median Earnings |
|---|---|
| 1 year | $77,637 |
| 2 years | $71,575 |
| 3 years | $82,077 |
| 4 years | $91,256 |
| 5 years | $113,966 |
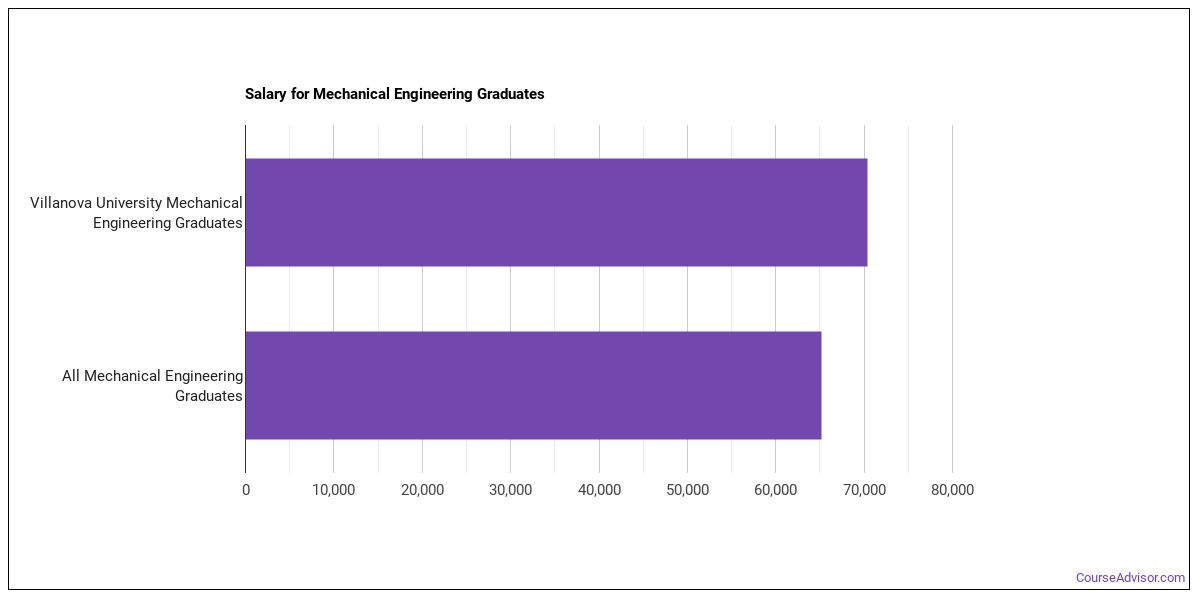
How does this compare to the school overall? Four years out, Mechanical Engineering graduates from Villanova University earn a median of $91,256, compared with $95,421 for all Villanova University graduates — about 4% lower than the school-wide median.

Median Debt at Graduation
Median student loan debt for Mechanical Engineering graduates from Villanova University comes in at $25,995.
Student Demographics & Diversity
The following sections describe the student demographics for Mechanical Engineering graduates at Villanova University, broken down by degree level.
Program-wide, Mechanical Engineering graduates at Villanova University are 23% women (23) and 77% men (77).
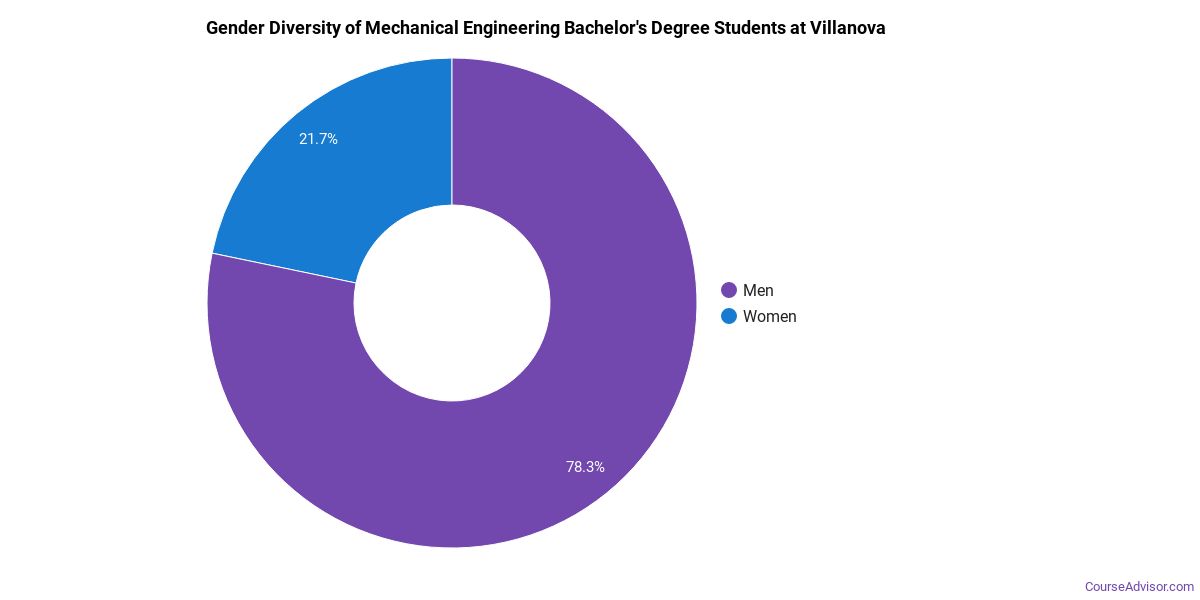
Mechanical Engineering Bachelor’s Program at Villanova University
Among the 74 bachelor’s mechanical engineering degrees awarded at Villanova University, 24% were women (18) and 76% were men (56).
The following table and chart show the race/ethnicity of Mechanical Engineering bachelor’s degree recipients at Villanova University.
| Race / Ethnicity | Number of Graduates |
|---|---|
| White | 59 |
| Hispanic / Latino | 7 |
| Black / African American | 3 |
| Asian | 3 |
| Two or More Races | 1 |
| International (Nonresident) | 1 |
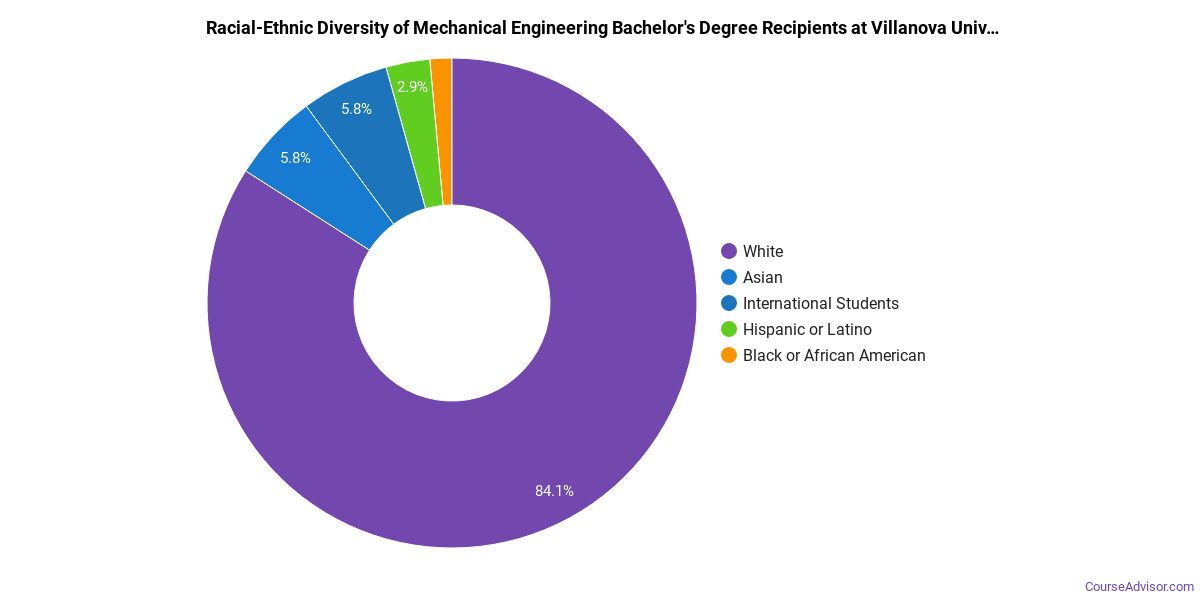
Racial-ethnic minorities make up 19% of Mechanical Engineering bachelor’s degree recipients at Villanova University, below the national average of 34%.*
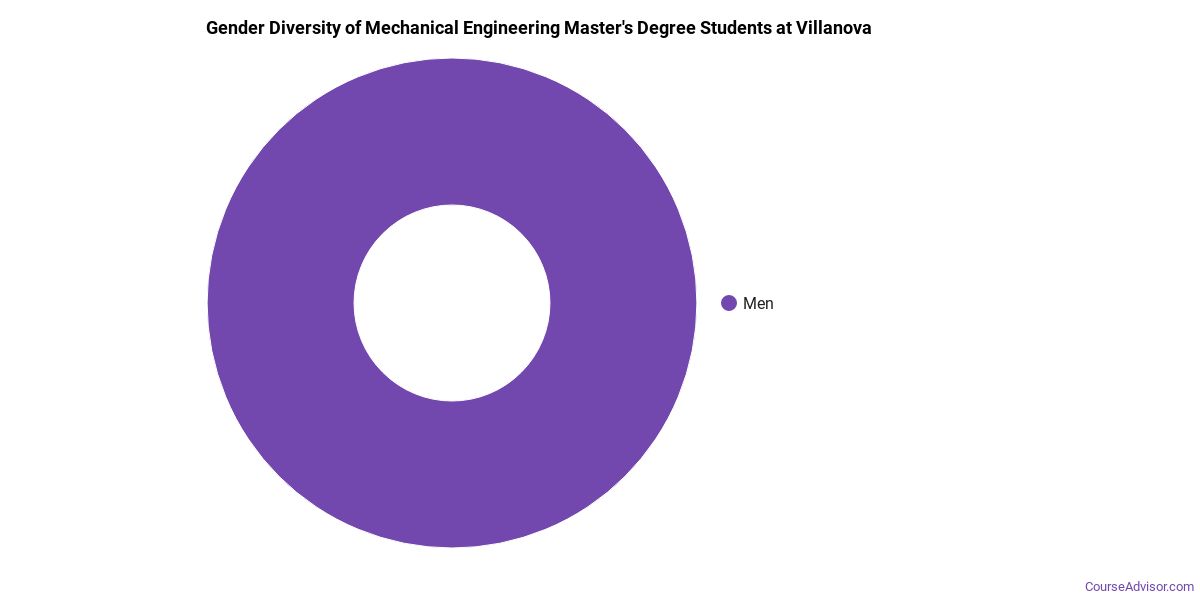
Mechanical Engineering Master’s Program at Villanova University
Among the 26 master’s mechanical engineering graduates at Villanova University, 19% were women (5) and 81% were men (21).
The following table and chart show the race/ethnicity of Mechanical Engineering master’s degree recipients at Villanova University.
| Race / Ethnicity | Number of Graduates |
|---|---|
| White | 16 |
| Hispanic / Latino | 3 |
| Black / African American | 3 |
| Asian | 1 |
| Two or More Races | 1 |
| International (Nonresident) | 2 |
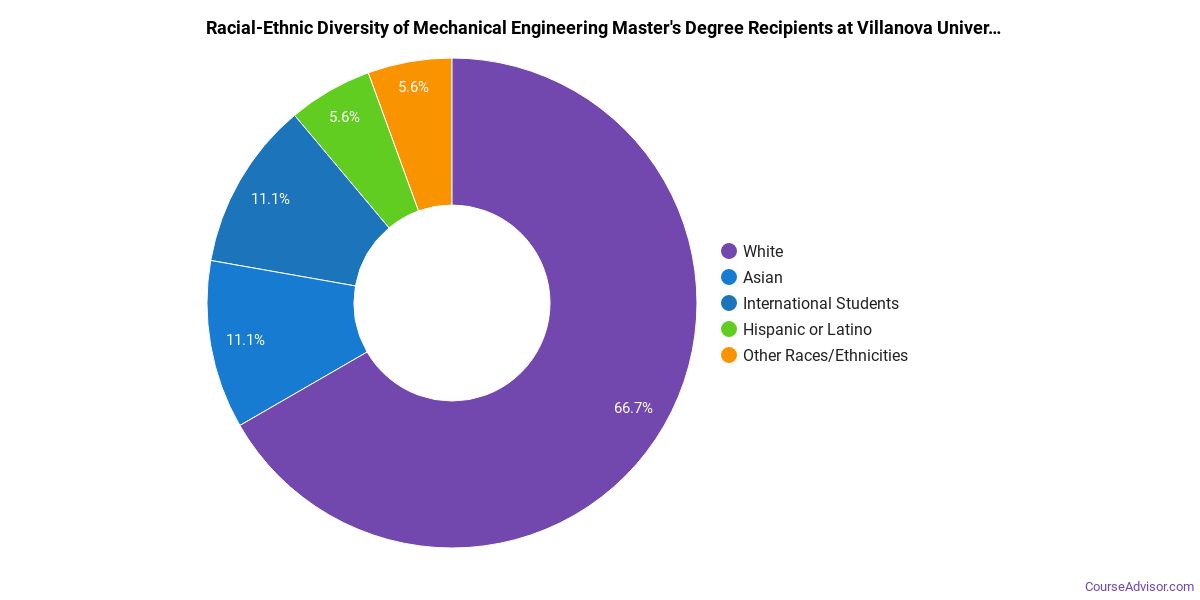
Minority students account for 31% of Mechanical Engineering master’s degree recipients at Villanova University, above the national average of 23%.*
*The racial-ethnic minorities figure is the total number of graduates minus White, international (nonresident), and unknown-race graduates.
More Specific Mechanical Engineering Concentrations at Villanova University
The Mechanical Engineering program at Villanova University includes the following sub-specializations:
| Concentration | Graduates |
|---|---|
| General Mechanical Engineering | 100 |
Highest-Paying Careers for Mechanical Engineering Graduates
Students who finish Mechanical Engineering program at Villanova University work across a variety of fields. Here are the best-paid careers for Mechanical Engineering majors, ordered by median annual salary:
| Occupation | Nationwide Median Wage |
|---|---|
| Fuel Cell Engineers | $137,020 |
| Automotive Engineers | $107,733 |
| Architectural and Engineering Managers | $101,277 |
| Biofuels/Biodiesel Technology and Product Development Managers | $89,263 |
| Cost Estimators | $80,966 |
| Engineering Teachers, Postsecondary | $79,889 |
| Mechanical Engineers | $79,543 |
| Aerospace Engineers | $63,328 |
References
- IPEDS — Integrated Postsecondary Education Data System
- U.S. Department of Education — College Scorecard
- O*NET Online (Bureau of Labor Statistics)
- National Center for Education Statistics
More about our data sources and methodologies.
Course Advisor provides higher-education, college and university, degree, program, career, salary, and other helpful information to students, faculty, institutions, and other internet audiences. Presented information and data are subject to change. Inclusion on this website does not imply or represent a direct relationship with the company, school, or brand. Information, though believed correct at time of publication, may not be correct, and no warranty is provided. Contact the schools to verify any information before relying on it. Financial aid may be available for those who qualify. The displayed options may include sponsored or recommended results, not necessarily based on your preferences.
© Course Advisor – All Rights Reserved.