Political Science & Government at University of Southern Mississippi
If you plan to study Political Science & Government, take a look at what University of Southern Mississippi. We’ve gathered the following information to help you decide.
University of Southern Mississippi sits in Hattiesburg, MS.
During the most recent reporting year, 27 political science & government graduations were recorded at University of Southern Mississippi.
Featured schools near , edit
Online & Distance Learning at University of Southern Mississippi
Many students take online classes at University of Southern Mississippi. Among 13,170 students, 4,140 (31%) were enrolled entirely in distance education and 5,550 (42%) took at least some classes online.
Student Demographics & Diversity
Take a look at the diversity of Political Science & Government graduates at University of Southern Mississippi, by degree type.
Program-wide, Political Science & Government graduates at University of Southern Mississippi are 63% women (17) and 37% men (10).
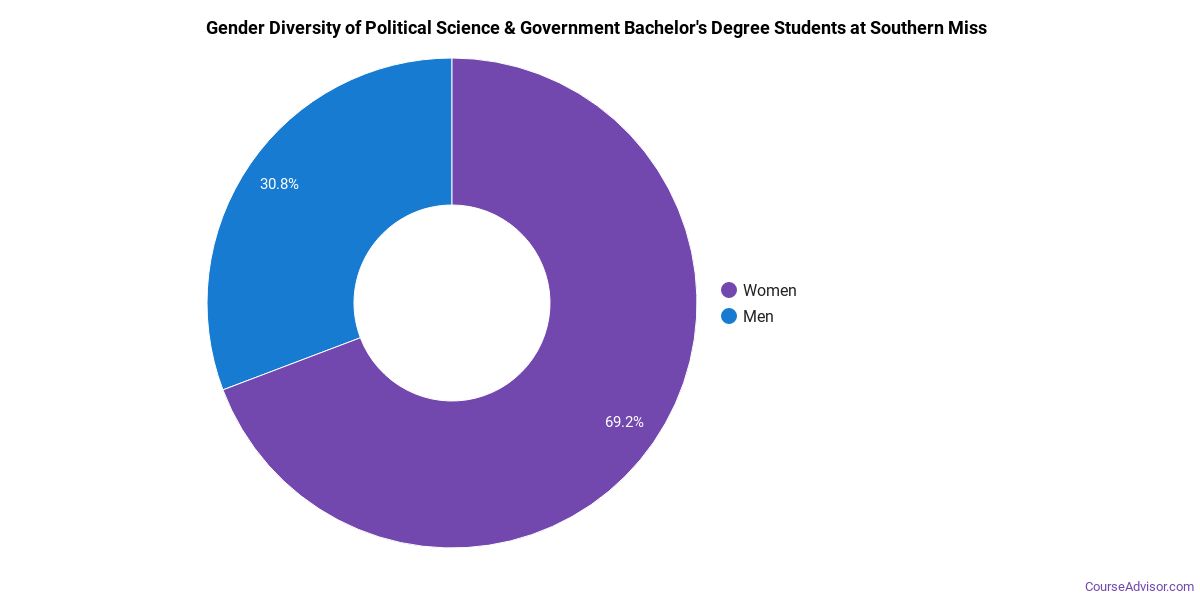
Political Science & Government Bachelor’s Program at University of Southern Mississippi
Of the 22 bachelor’s political science & government degrees awarded at University of Southern Mississippi, 55% were women (12) and 45% were men (10).
The following table and chart show the race/ethnicity of Political Science & Government bachelor’s degree recipients at University of Southern Mississippi.
| Race / Ethnicity | Number of Graduates |
|---|---|
| White | 9 |
| Hispanic / Latino | 2 |
| Black / African American | 7 |
| Asian | 1 |
| Two or More Races | 2 |
| International (Nonresident) | 1 |
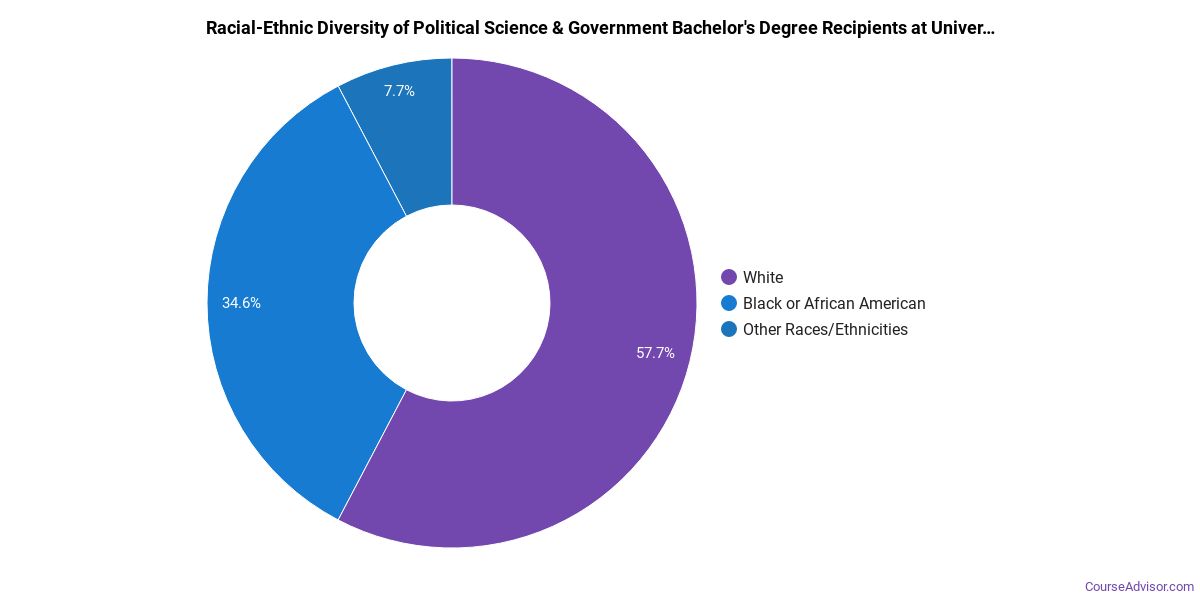
Racial-ethnic minorities make up 55% of Political Science & Government bachelor’s degree recipients at University of Southern Mississippi, above the national average of 41%.*
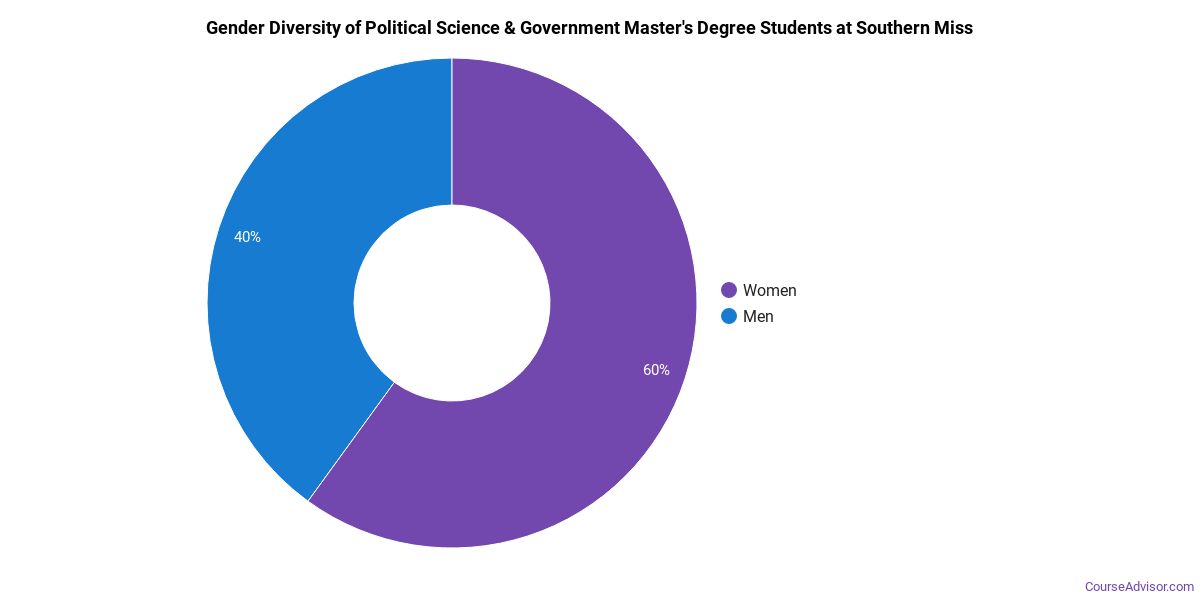
Political Science & Government Master’s Program at University of Southern Mississippi
Of the 5 master’s political science & government degrees awarded at University of Southern Mississippi, 100% were women (5) and 0% were men (0).
The following table and chart show the race/ethnicity of Political Science & Government master’s degree recipients at University of Southern Mississippi.
| Race / Ethnicity | Number of Graduates |
|---|---|
| White | 1 |
| Hispanic / Latino | 1 |
| Black / African American | 2 |
| International (Nonresident) | 1 |
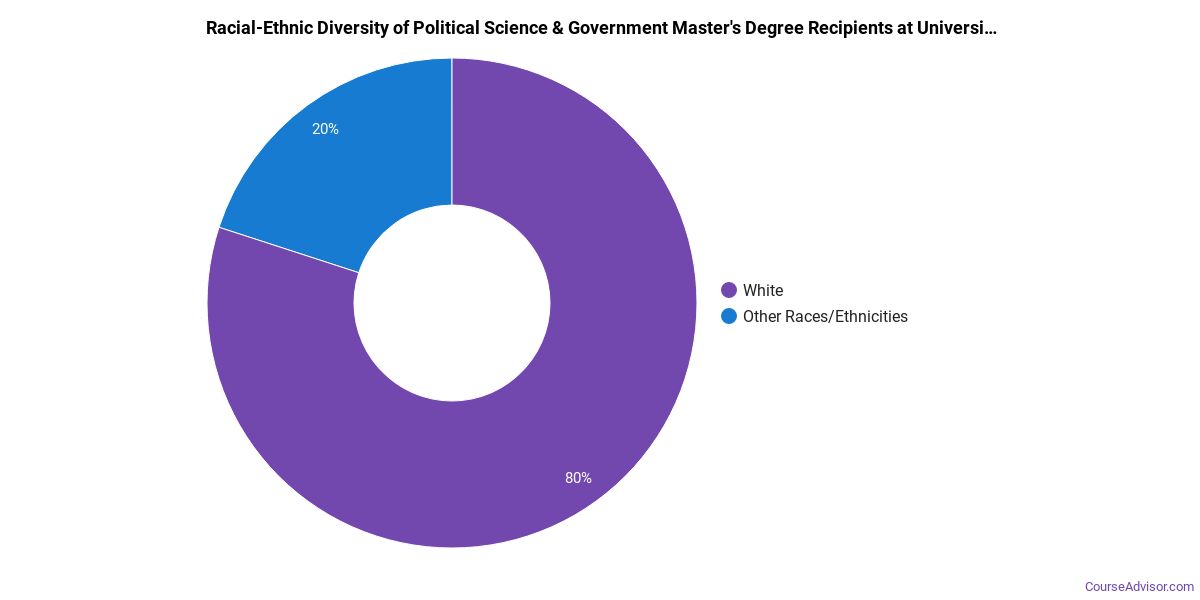
Minority students account for 60% of Political Science & Government master’s degree recipients at University of Southern Mississippi, higher than the national average of 29%.*
*The racial-ethnic minorities figure is the total number of graduates minus White, international (nonresident), and unknown-race graduates.
More Specific Political Science & Government Concentrations at University of Southern Mississippi
This Political Science & Government program at University of Southern Mississippi includes the following sub-specializations:
| Concentration | Graduates |
|---|---|
| Political Science | 27 |
Top-Paying Careers for Political Science & Government Graduates
Graduates of the Political Science & Government program at University of Southern Mississippi pursue many career paths. Here are the highest-paying careers for Political Science & Government graduates, ordered by median annual salary:
| Occupation | Nationwide Median Wage |
|---|---|
| Wind Energy Development Managers | $169,952 |
| Loss Prevention Managers | $165,723 |
| Wind Energy Operations Managers | $122,567 |
| Compliance Managers | $117,178 |
| Brownfield Redevelopment Specialists and Site Managers | $99,321 |
| Managers, All Other | $95,684 |
| Environmental Economists | $86,726 |
| Secondary School Teachers, Except Special and Career/Technical Education | $77,927 |
| Regulatory Affairs Managers | $77,828 |
| Economists | $73,611 |
References
- IPEDS — Integrated Postsecondary Education Data System
- U.S. Department of Education — College Scorecard
- O*NET Online (Bureau of Labor Statistics)
- National Center for Education Statistics
More about our data sources and methodologies.
Course Advisor provides higher-education, college and university, degree, program, career, salary, and other helpful information to students, faculty, institutions, and other internet audiences. Presented information and data are subject to change. Inclusion on this website does not imply or represent a direct relationship with the company, school, or brand. Information, though believed correct at time of publication, may not be correct, and no warranty is provided. Contact the schools to verify any information before relying on it. Financial aid may be available for those who qualify. The displayed options may include sponsored or recommended results, not necessarily based on your preferences.
© Course Advisor – All Rights Reserved.