Political Science & Government at University of South Florida
If you plan to study Political Science & Government, you may want to check out the program at University of South Florida. The following information will help you decide if it is a good fit for you.
University of South Florida sits in Tampa, FL.
During the most recent reporting year, 199 political science & government degrees were granted at University of South Florida.
Featured schools near , edit
Online Class Availability at University of South Florida
Distance learning is available at University of South Florida. Of 49,622 students, 7,519 (15%) studied exclusively online and 25,913 (52%) took at least some classes online.
Political Science & Government Rankings at University of South Florida
These rankings give you a sense of how University of South Florida’s Political Science & Government program against other schools offering the same major.
Bachelor’s-Level Rankings
| Ranking | Scope | Rank |
|---|---|---|
| Best Value | Florida | #3 of 17 |
| Best Schools (Quality) | Florida | #6 of 17 |
| Best Value | Southeast (Region) | #8 of 151 |
| Best Schools (Quality) | Southeast (Region) | #40 of 151 |
| Best Value | Nationwide | #91 of 676 |
| Best Schools (Quality) | Nationwide | #270 of 677 |
Master’s-Level Rankings
| Ranking | Scope | Rank |
|---|---|---|
| Best Value | Florida | #3 of 17 |
| Best Schools (Quality) | Florida | #6 of 17 |
| Best Value | Southeast (Region) | #8 of 151 |
| Best Schools (Quality) | Southeast (Region) | #40 of 151 |
| Best Value | Nationwide | #91 of 676 |
| Best Schools (Quality) | Nationwide | #270 of 677 |
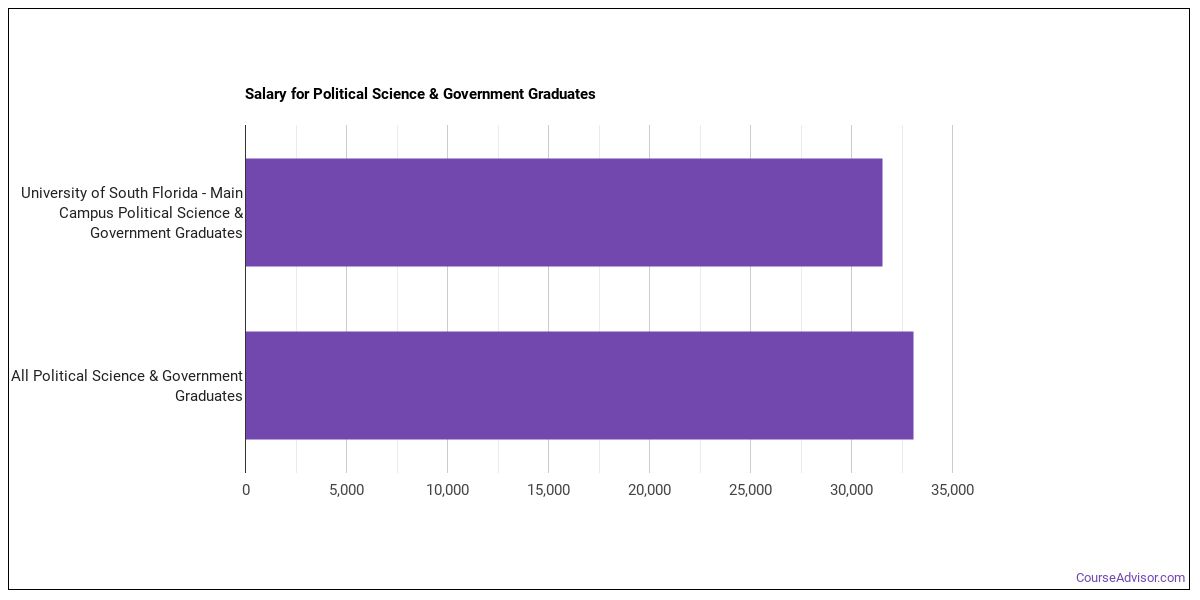
Earnings for Political Science & Government Graduates from University of South Florida
Those who finish University of South Florida’s Political Science & Government program earn at the following median levels (per the U.S. Department of Education’s College Scorecard):
| Years After Graduation | Median Earnings |
|---|---|
| 1 year | $31,544 |
| 2 years | $31,185 |
| 3 years | $37,209 |
| 4 years | $47,577 |
| 5 years | $58,714 |
How does this compare to the school overall? Four years after graduating, Political Science & Government graduates from University of South Florida earn a median of $47,577, compared with $58,776 for all University of South Florida graduates — about 19% lower than the school-wide median.

Median Debt at Graduation
Median student loan debt for Political Science & Government graduates from University of South Florida stands at $20,609.
Student Demographics & Diversity
Take a look at the student demographics for Political Science & Government graduates at University of South Florida, broken down by degree level.
Looking at the program as a whole, Political Science & Government graduates at University of South Florida are 48% women (96) and 52% men (103).
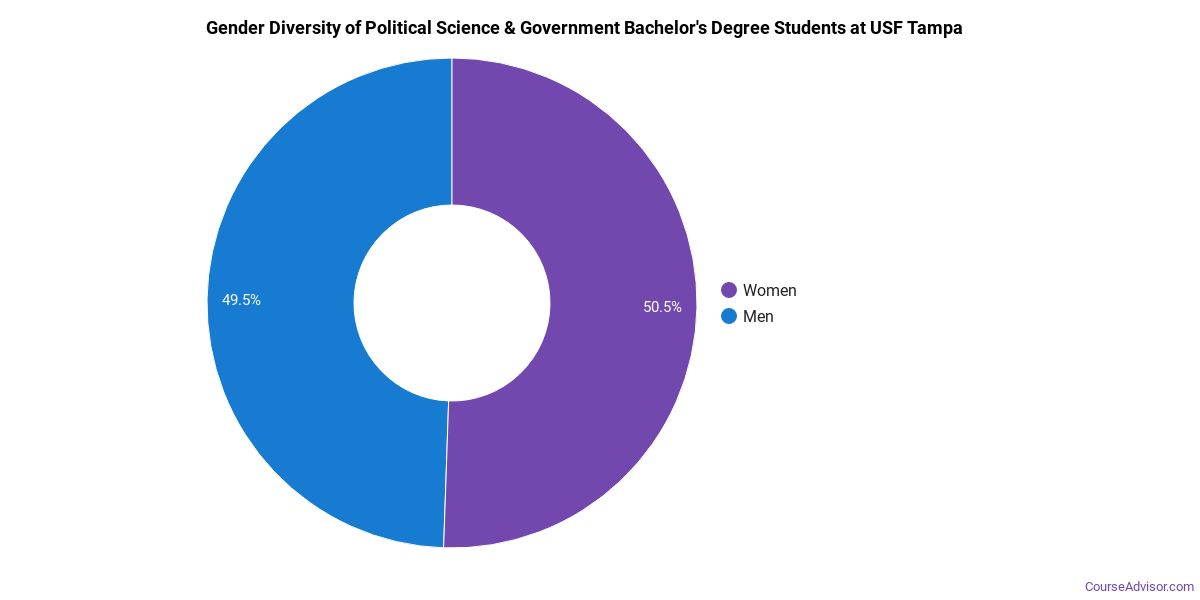
Political Science & Government Bachelor’s Program at University of South Florida
Among the 194 bachelor’s political science & government graduates at University of South Florida, 49% were women (96) and 51% were men (98).
The following table and chart show the race/ethnicity of Political Science & Government bachelor’s degree recipients at University of South Florida.
| Race / Ethnicity | Number of Graduates |
|---|---|
| White | 105 |
| Hispanic / Latino | 53 |
| Black / African American | 16 |
| Asian | 8 |
| Two or More Races | 7 |
| International (Nonresident) | 4 |
| Unknown | 1 |
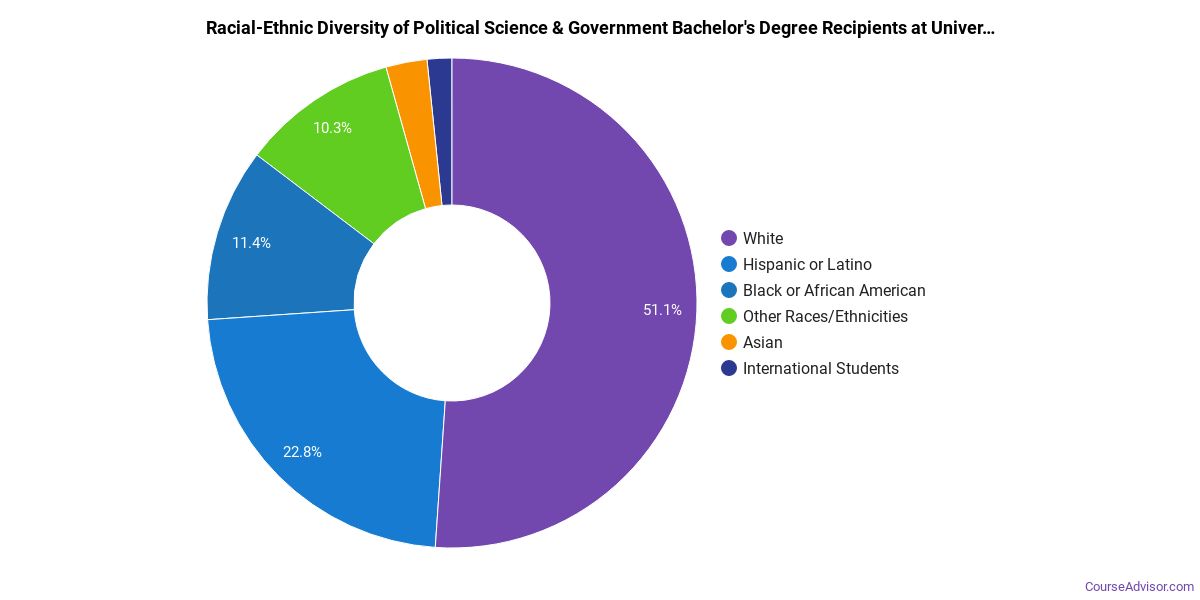
Racial-ethnic minorities make up 43% of Political Science & Government bachelor’s degree recipients at University of South Florida, higher than the national average of 41%.*
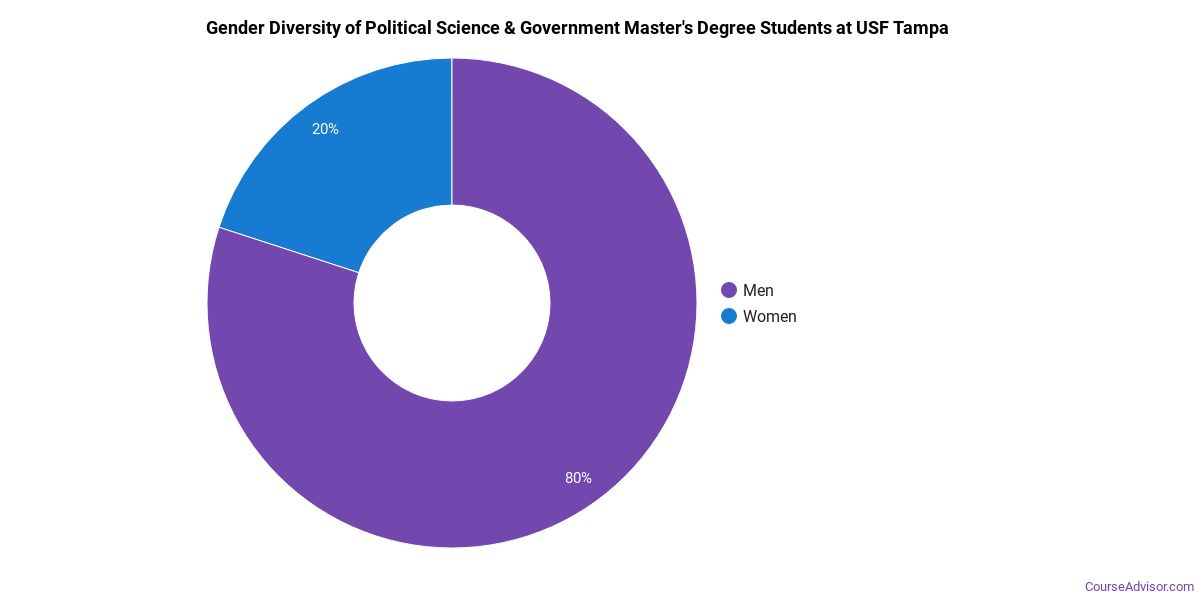
Political Science & Government Master’s Program at University of South Florida
Among the 5 master’s political science & government graduates at University of South Florida, 0% were women (0) and 100% were men (5).
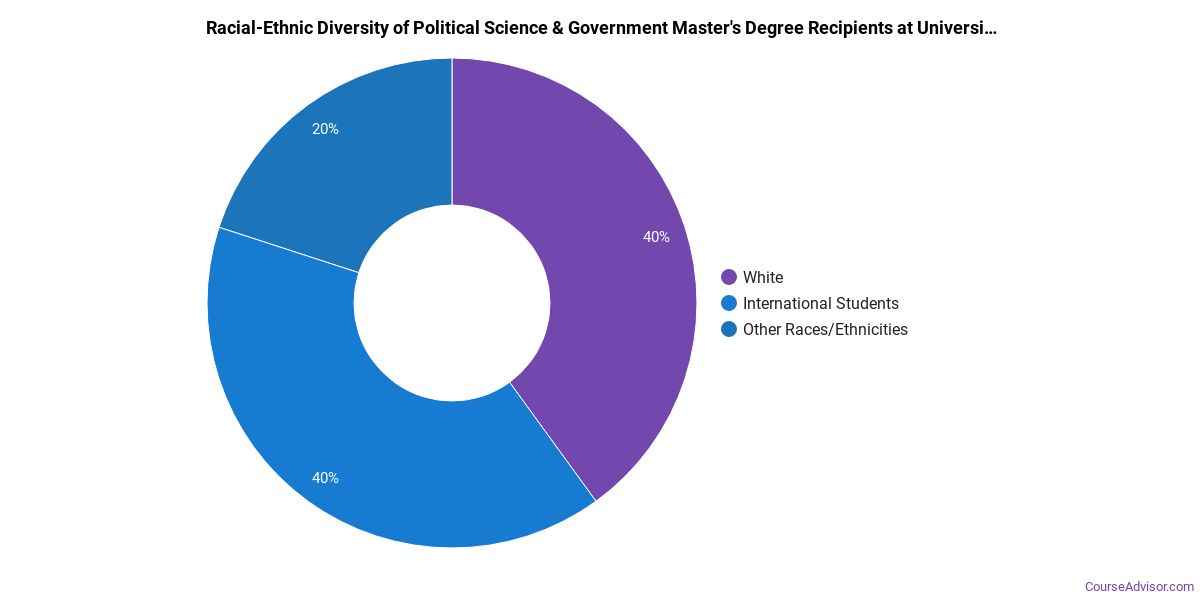
The following table and chart show the race/ethnicity of Political Science & Government master’s degree recipients at University of South Florida.
| Race / Ethnicity | Number of Graduates |
|---|---|
| White | 4 |
| Unknown | 1 |
*The racial-ethnic minorities figure is the total number of graduates minus White, international (nonresident), and unknown-race graduates.
More Specific Political Science & Government Concentrations at University of South Florida
The Political Science & Government program at University of South Florida offers more specialized concentrations:
| Concentration | Graduates |
|---|---|
| Political Science | 199 |
Highest-Paying Careers for Political Science & Government Graduates
Students who finish Political Science & Government program at University of South Florida work across a variety of fields. The table below ranks the top-paying careers for Political Science & Government majors, ordered by median annual salary:
| Occupation | Nationwide Median Wage |
|---|---|
| Wind Energy Development Managers | $169,952 |
| Loss Prevention Managers | $165,723 |
| Wind Energy Operations Managers | $122,567 |
| Compliance Managers | $117,178 |
| Brownfield Redevelopment Specialists and Site Managers | $99,321 |
| Managers, All Other | $95,684 |
| Environmental Economists | $86,726 |
| Secondary School Teachers, Except Special and Career/Technical Education | $77,927 |
| Regulatory Affairs Managers | $77,828 |
| Economists | $73,611 |
References
- IPEDS — Integrated Postsecondary Education Data System
- U.S. Department of Education — College Scorecard
- O*NET Online (Bureau of Labor Statistics)
- National Center for Education Statistics
More about our data sources and methodologies.
Course Advisor provides higher-education, college and university, degree, program, career, salary, and other helpful information to students, faculty, institutions, and other internet audiences. Presented information and data are subject to change. Inclusion on this website does not imply or represent a direct relationship with the company, school, or brand. Information, though believed correct at time of publication, may not be correct, and no warranty is provided. Contact the schools to verify any information before relying on it. Financial aid may be available for those who qualify. The displayed options may include sponsored or recommended results, not necessarily based on your preferences.
© Course Advisor – All Rights Reserved.