Health/Medical Admin Services at University of Pittsburgh-Pittsburgh Campus
If you are interested in studying Health/Medical Admin Services, consider the program at University of Pittsburgh-Pittsburgh Campus. Get started with the following essential facts.
University of Pittsburgh-Pittsburgh Campus is located in Pittsburgh, PA.
For the most recent IPEDS reporting year, 60 health/medical admin services degrees were granted at University of Pittsburgh-Pittsburgh Campus.
Featured schools near , edit
Online & Distance Learning at University of Pittsburgh-Pittsburgh Campus
Distance learning is available at University of Pittsburgh-Pittsburgh Campus. Among 35,724 students, 1,465 (4%) were enrolled entirely in distance education and 6,044 (17%) took at least some classes online.
Health/Medical Admin Services Rankings at University of Pittsburgh-Pittsburgh Campus
Rankings can help you compare University of Pittsburgh-Pittsburgh Campus’s Health/Medical Admin Services program to other colleges that offer this major.
Bachelor’s-Level Rankings
| Ranking | Scope | Rank |
|---|---|---|
| Best Schools (Quality) | Pennsylvania | #5 of 41 |
| Best Schools (Quality) | Middle Atlantic (Region) | #17 of 123 |
| Best Value | Pennsylvania | #32 of 41 |
| Best Schools (Quality) | Nationwide | #52 of 915 |
| Best Value | Middle Atlantic (Region) | #98 of 120 |
| Best Value | Nationwide | #824 of 928 |
Master’s-Level Rankings
| Ranking | Scope | Rank |
|---|---|---|
| Best Schools (Quality) | Pennsylvania | #5 of 41 |
| Best Schools (Quality) | Middle Atlantic (Region) | #17 of 123 |
| Best Value | Pennsylvania | #32 of 41 |
| Best Schools (Quality) | Nationwide | #52 of 915 |
| Best Value | Middle Atlantic (Region) | #98 of 120 |
| Best Value | Nationwide | #824 of 928 |
Median Debt at Graduation
Median student loan debt for Health/Medical Admin Services graduates from University of Pittsburgh-Pittsburgh Campus is $22,081.
Student Demographics & Diversity
Below you’ll find the student demographics for Health/Medical Admin Services graduates at University of Pittsburgh-Pittsburgh Campus, by degree type.
Looking at the program as a whole, Health/Medical Admin Services graduates at University of Pittsburgh-Pittsburgh Campus are 72% women (43) and 28% men (17).
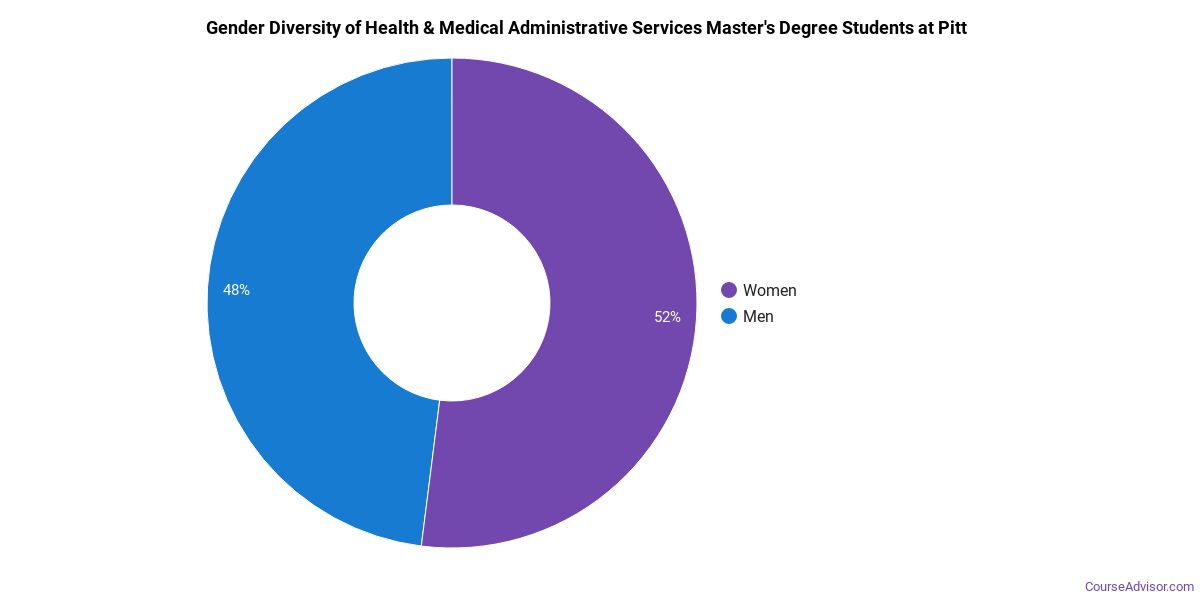
Health/Medical Admin Services Master’s Program at University of Pittsburgh-Pittsburgh Campus
Among the 40 master’s health/medical admin services graduates at University of Pittsburgh-Pittsburgh Campus, 68% were women (27) and 32% were men (13).
The following table and chart show the race/ethnicity of Health/Medical Admin Services master’s degree recipients at University of Pittsburgh-Pittsburgh Campus.
| Race / Ethnicity | Number of Graduates |
|---|---|
| White | 19 |
| Hispanic / Latino | 1 |
| Black / African American | 8 |
| Asian | 11 |
| Two or More Races | 1 |
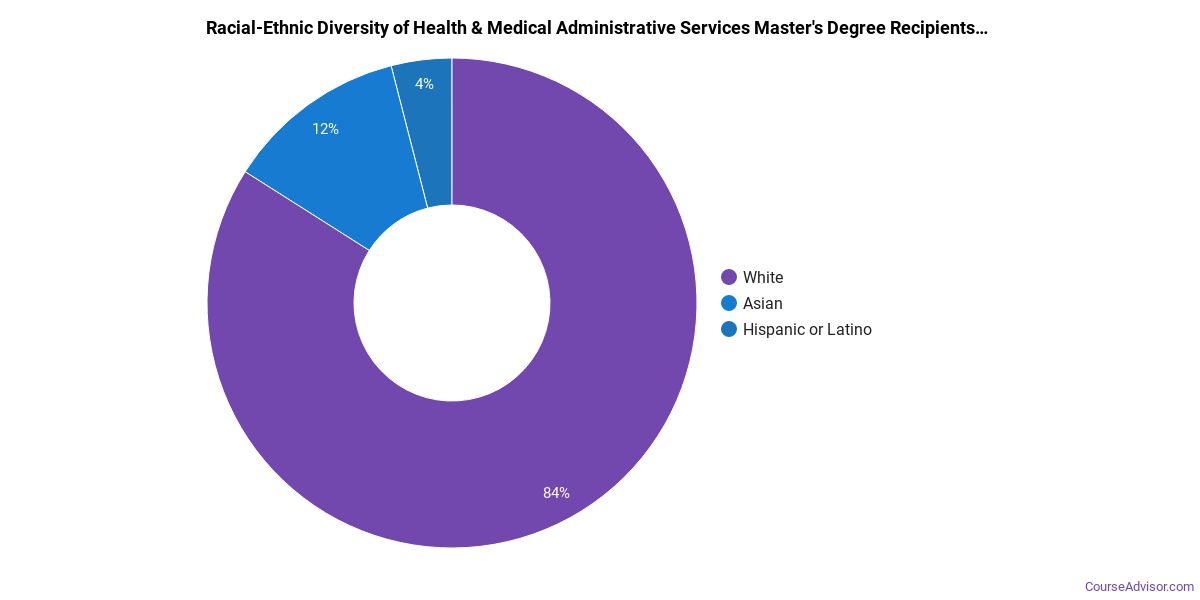
Minority students account for 52% of Health/Medical Admin Services master’s degree recipients at University of Pittsburgh-Pittsburgh Campus, above the national average of 45%.*
*The racial-ethnic minorities figure is the total number of graduates minus White, international (nonresident), and unknown-race graduates.
More Specific Health/Medical Admin Services Concentrations at University of Pittsburgh-Pittsburgh Campus
The Health/Medical Admin Services program at University of Pittsburgh-Pittsburgh Campus breaks down into more specific concentrations:
| Concentration | Graduates |
|---|---|
| Health Care Management | 60 |
Best-Paid Careers for Health/Medical Admin Services Graduates
Graduates of the Health/Medical Admin Services program at University of Pittsburgh-Pittsburgh Campus go on to a range of careers. Here are the best-paid careers for Health/Medical Admin Services majors, ordered by median annual salary:
| Occupation | Nationwide Median Wage |
|---|---|
| Loss Prevention Managers | $165,723 |
| Education Administrators, Postsecondary | $161,927 |
| Administrative Services Managers | $158,084 |
| Facilities Managers | $157,669 |
| Medical Records Specialists | $153,246 |
| Medical and Health Services Managers | $129,557 |
| Environmental Compliance Inspectors | $119,630 |
| Healthcare Practitioners and Technical Workers, All Other | $117,846 |
| Compliance Managers | $117,178 |
| Information Security Analysts | $111,930 |
References
- IPEDS — Integrated Postsecondary Education Data System
- U.S. Department of Education — College Scorecard
- O*NET Online (Bureau of Labor Statistics)
- National Center for Education Statistics
More about our data sources and methodologies.
Course Advisor provides higher-education, college and university, degree, program, career, salary, and other helpful information to students, faculty, institutions, and other internet audiences. Presented information and data are subject to change. Inclusion on this website does not imply or represent a direct relationship with the company, school, or brand. Information, though believed correct at time of publication, may not be correct, and no warranty is provided. Contact the schools to verify any information before relying on it. Financial aid may be available for those who qualify. The displayed options may include sponsored or recommended results, not necessarily based on your preferences.
© Course Advisor – All Rights Reserved.