General Computer Science at University of Maryland-Baltimore County
If you plan to study General Computer Science, you may want to check out the program at University of Maryland-Baltimore County. We’ve gathered the following information to help you decide.
University of Maryland-Baltimore County is in Baltimore, MD.
In the most recent year for which we have data, 494 general computer science graduations were recorded at University of Maryland-Baltimore County.
Featured schools near , edit
Online & Distance Learning at University of Maryland-Baltimore County
Many students take online classes at University of Maryland-Baltimore County. Among 13,906 students, 580 (4%) studied exclusively online and 8,081 (58%) took at least some classes online.
Student Demographics & Diversity
Below you’ll find the diversity of General Computer Science graduates at University of Maryland-Baltimore County, by degree type.
Looking at the program as a whole, General Computer Science graduates at University of Maryland-Baltimore County are 23% women (115) and 77% men (379).
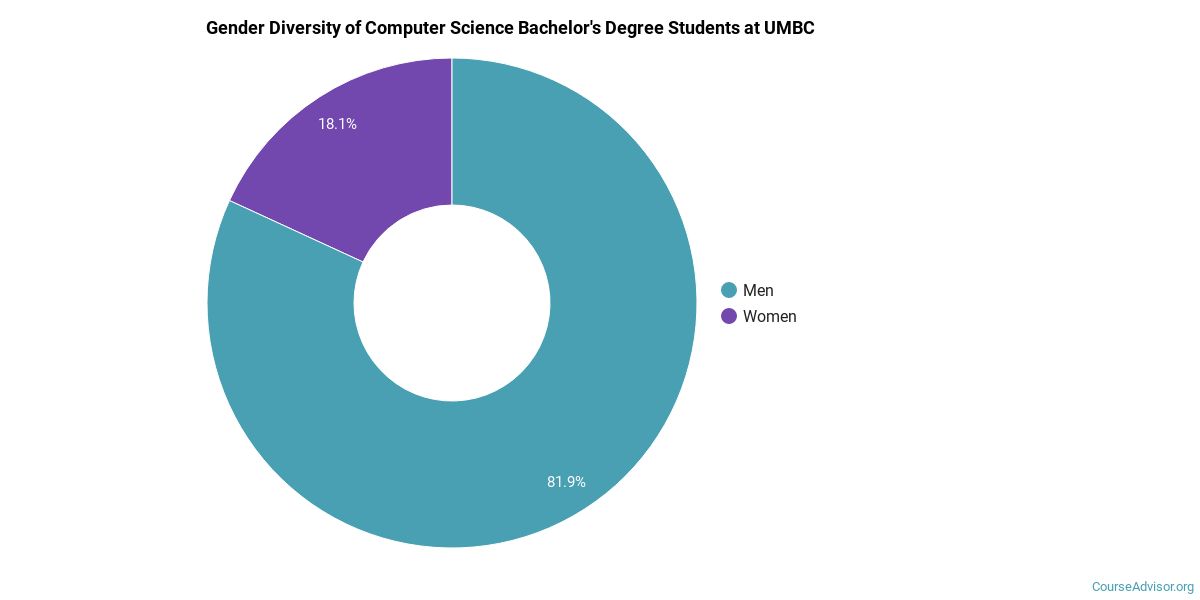
General Computer Science Bachelor’s Program at University of Maryland-Baltimore County
Among the 324 bachelor’s general computer science degrees awarded at University of Maryland-Baltimore County, 18% were women (58) and 82% were men (266).
The following table and chart show the race/ethnicity of General Computer Science bachelor’s degree recipients at University of Maryland-Baltimore County.
| Race / Ethnicity | Number of Graduates |
|---|---|
| White | 140 |
| Hispanic / Latino | 20 |
| Black / African American | 56 |
| Asian | 74 |
| Two or More Races | 14 |
| International (Nonresident) | 17 |
| Unknown | 3 |

Racial-ethnic minorities make up 51% of General Computer Science bachelor’s degree recipients at University of Maryland-Baltimore County, above the national average of 47%.*
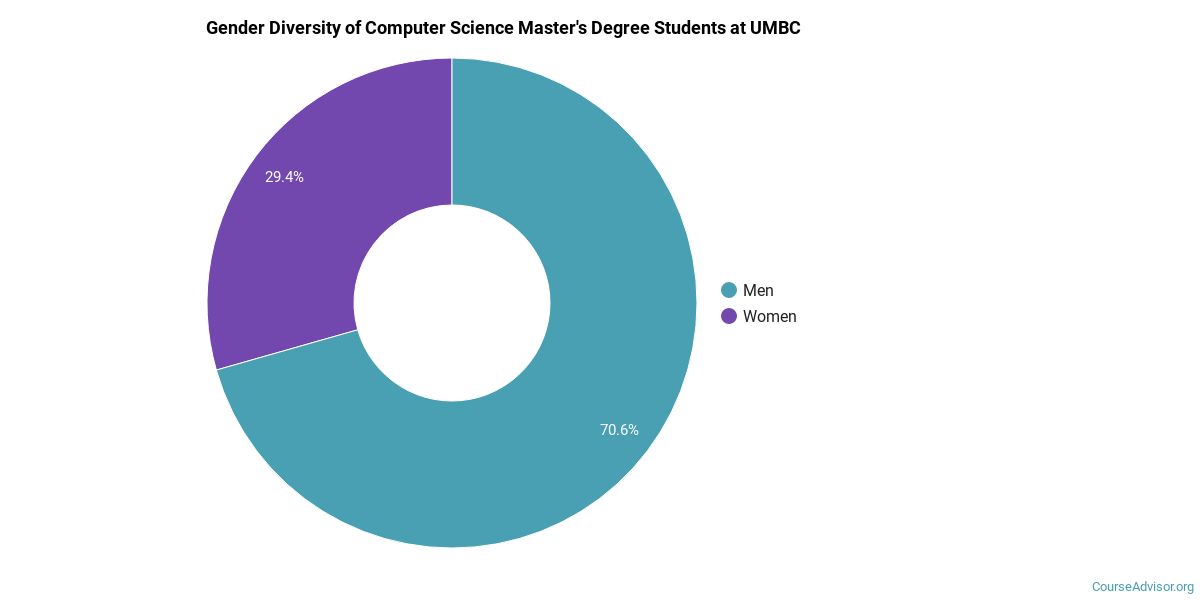
General Computer Science Master’s Program at University of Maryland-Baltimore County
Among the 163 master’s general computer science degrees awarded at University of Maryland-Baltimore County, 34% were women (56) and 66% were men (107).
The following table and chart show the race/ethnicity of General Computer Science master’s degree recipients at University of Maryland-Baltimore County.
| Race / Ethnicity | Number of Graduates |
|---|---|
| White | 10 |
| Black / African American | 2 |
| Asian | 4 |
| Two or More Races | 2 |
| International (Nonresident) | 145 |

Racial-ethnic minorities make up 5% of General Computer Science master’s degree recipients at University of Maryland-Baltimore County, lower than the national average of 12%.*
General Computer Science Doctoral Program at University of Maryland-Baltimore County
Of the 7 doctoral general computer science degrees awarded at University of Maryland-Baltimore County, 14% were women (1) and 86% were men (6).

The following table and chart show the race/ethnicity of General Computer Science doctoral degree recipients at University of Maryland-Baltimore County.
| Race / Ethnicity | Number of Graduates |
|---|---|
| White | 2 |
| International (Nonresident) | 5 |

*The racial-ethnic minorities figure is the total number of graduates minus White, international (nonresident), and unknown-race graduates.
Best-Paid Careers for General Computer Science Graduates
Those who complete General Computer Science program at University of Maryland-Baltimore County work across a variety of fields. Below are the top-paying careers for General Computer Science graduates, ordered by median annual salary:
| Occupation | Nationwide Median Wage |
|---|---|
| Computer and Information Systems Managers | $175,079 |
| Computer Occupations, All Other | $159,837 |
| Database Architects | $148,480 |
| Document Management Specialists | $147,490 |
| Business Intelligence Analysts | $143,840 |
| Information Security Engineers | $142,543 |
| Computer Systems Engineers/Architects | $140,795 |
| Web Developers | $125,527 |
| Information Technology Project Managers | $124,655 |
| Blockchain Engineers | $123,667 |
References
- IPEDS — Integrated Postsecondary Education Data System
- U.S. Department of Education — College Scorecard
- O*NET Online (Bureau of Labor Statistics)
- National Center for Education Statistics
More about our data sources and methodologies.
Course Advisor provides higher-education, college and university, degree, program, career, salary, and other helpful information to students, faculty, institutions, and other internet audiences. Presented information and data are subject to change. Inclusion on this website does not imply or represent a direct relationship with the company, school, or brand. Information, though believed correct at time of publication, may not be correct, and no warranty is provided. Contact the schools to verify any information before relying on it. Financial aid may be available for those who qualify. The displayed options may include sponsored or recommended results, not necessarily based on your preferences.
© Course Advisor – All Rights Reserved.