Political Science & Government at University of Houston
What traits are you looking for in a school for Political Science & Government, take a look at what University of Houston. The following information will help you decide if it is a good fit for you.
University of Houston is located in Houston, TX.
For the most recent IPEDS reporting year, 207 political science & government degrees were granted at University of Houston.
Featured schools near , edit
Studying Online at University of Houston
Many students take online classes at University of Houston. Of 47,980 students, 5,933 (12%) studied exclusively online and 26,962 (56%) took at least some classes online.
Political Science & Government Rankings at University of Houston
Use these rankings to compare University of Houston’s Political Science & Government program against peer institutions.
Bachelor’s-Level Rankings
| Ranking | Scope | Rank |
|---|---|---|
| Best Schools (Quality) | Texas | #9 of 42 |
| Best Schools (Quality) | Southwest (Region) | #15 of 56 |
| Best Value | Texas | #16 of 42 |
| Best Value | Southwest (Region) | #21 of 55 |
| Best Value | Nationwide | #177 of 676 |
| Best Schools (Quality) | Nationwide | #247 of 677 |
Master’s-Level Rankings
| Ranking | Scope | Rank |
|---|---|---|
| Best Schools (Quality) | Texas | #9 of 42 |
| Best Schools (Quality) | Southwest (Region) | #15 of 56 |
| Best Value | Texas | #16 of 42 |
| Best Value | Southwest (Region) | #21 of 55 |
| Best Value | Nationwide | #177 of 676 |
| Best Schools (Quality) | Nationwide | #247 of 677 |
Doctoral-Level Rankings
| Ranking | Scope | Rank |
|---|---|---|
| Best Schools (Quality) | Texas | #9 of 42 |
| Best Schools (Quality) | Southwest (Region) | #15 of 56 |
| Best Value | Texas | #16 of 42 |
| Best Value | Southwest (Region) | #21 of 55 |
| Best Value | Nationwide | #177 of 676 |
| Best Schools (Quality) | Nationwide | #247 of 677 |
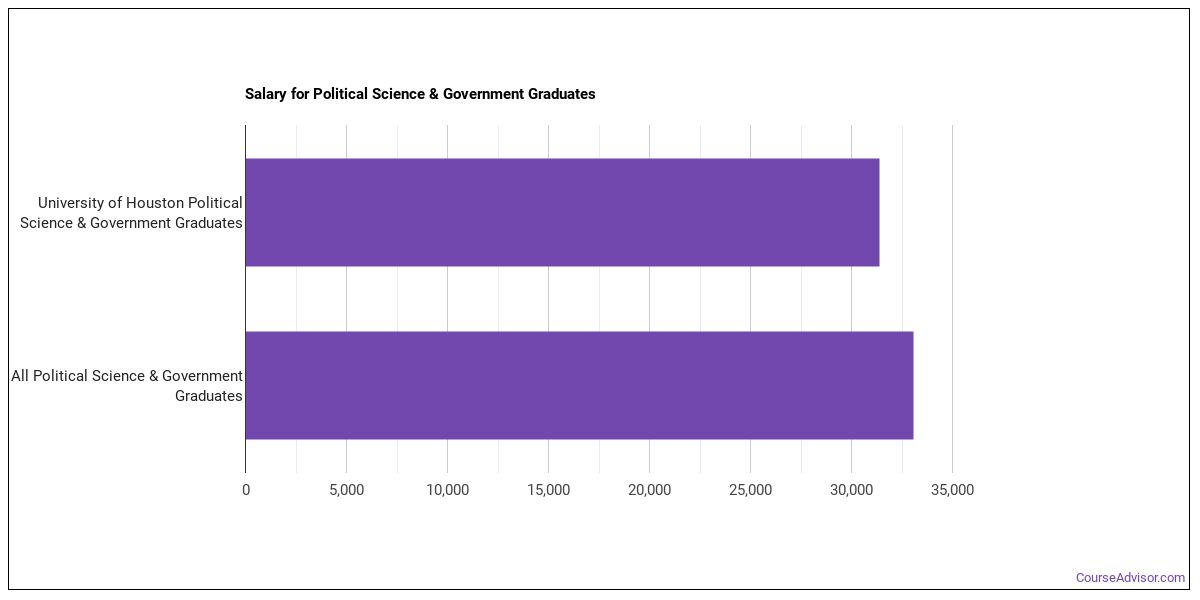
Earnings for Political Science & Government Graduates from University of Houston
Students who complete University of Houston’s Political Science & Government program earn at the following median levels (per the U.S. Department of Education’s College Scorecard):
| Years After Graduation | Median Earnings |
|---|---|
| 1 year | $31,388 |
| 2 years | $37,671 |
| 3 years | $41,415 |
| 4 years | $52,679 |
| 5 years | $61,848 |
How does this compare to the school overall? At the four-year mark, Political Science & Government graduates from University of Houston take home a median $52,679, compared with $66,496 for all University of Houston graduates — about 21% lower than the school-wide median.

Median Debt at Graduation
The median debt for Political Science & Government graduates from University of Houston is $19,500.
Student Demographics & Diversity
The following sections describe the diversity of Political Science & Government graduates at University of Houston, broken down by degree level.
Across all degree levels, Political Science & Government graduates at University of Houston are 59% women (122) and 41% men (85).
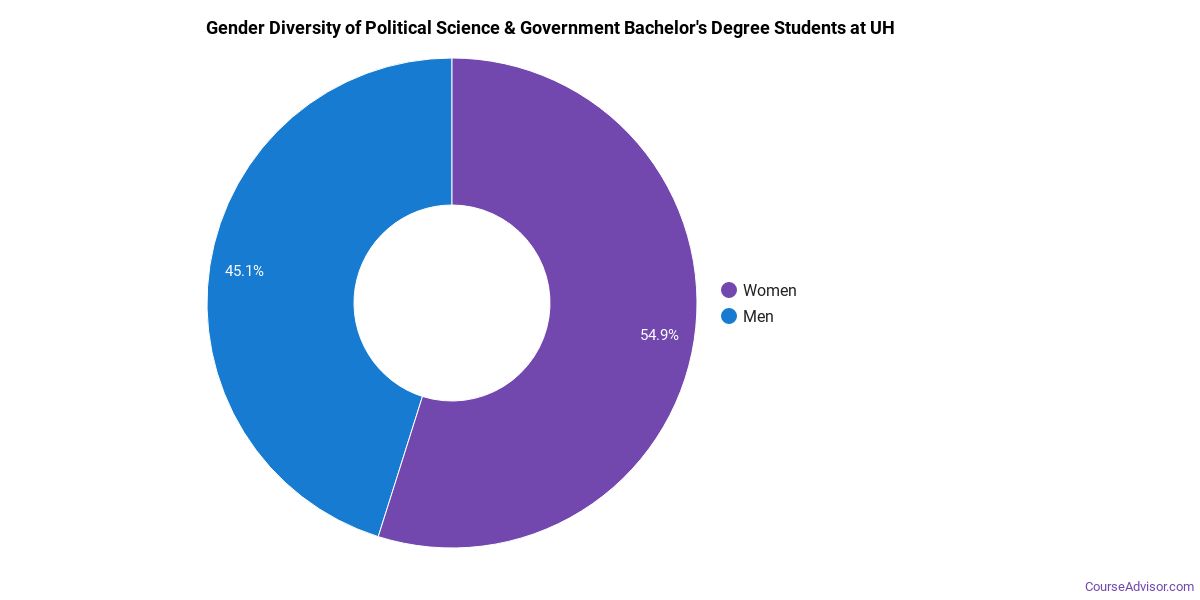
Political Science & Government Bachelor’s Program at University of Houston
Among the 202 bachelor’s political science & government degrees awarded at University of Houston, 59% were women (119) and 41% were men (83).
The following table and chart show the race/ethnicity of Political Science & Government bachelor’s degree recipients at University of Houston.
| Race / Ethnicity | Number of Graduates |
|---|---|
| White | 46 |
| Hispanic / Latino | 84 |
| Black / African American | 27 |
| Asian | 28 |
| American Indian / Alaska Native | 1 |
| Two or More Races | 7 |
| International (Nonresident) | 7 |
| Unknown | 2 |
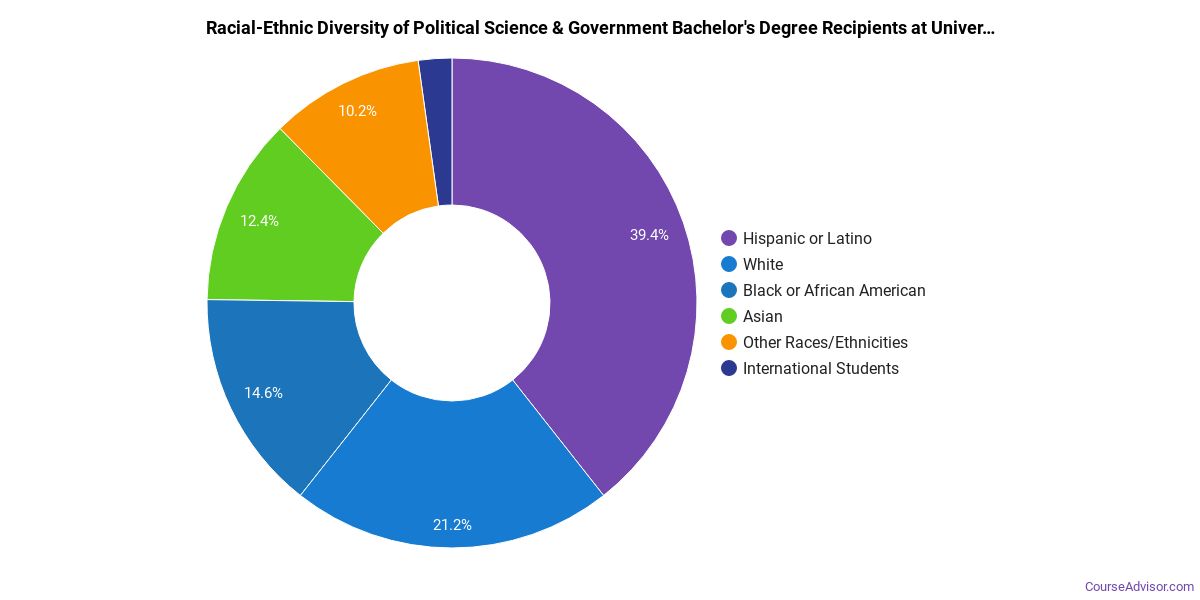
Minority students account for 73% of Political Science & Government bachelor’s degree recipients at University of Houston, above the national average of 41%.*
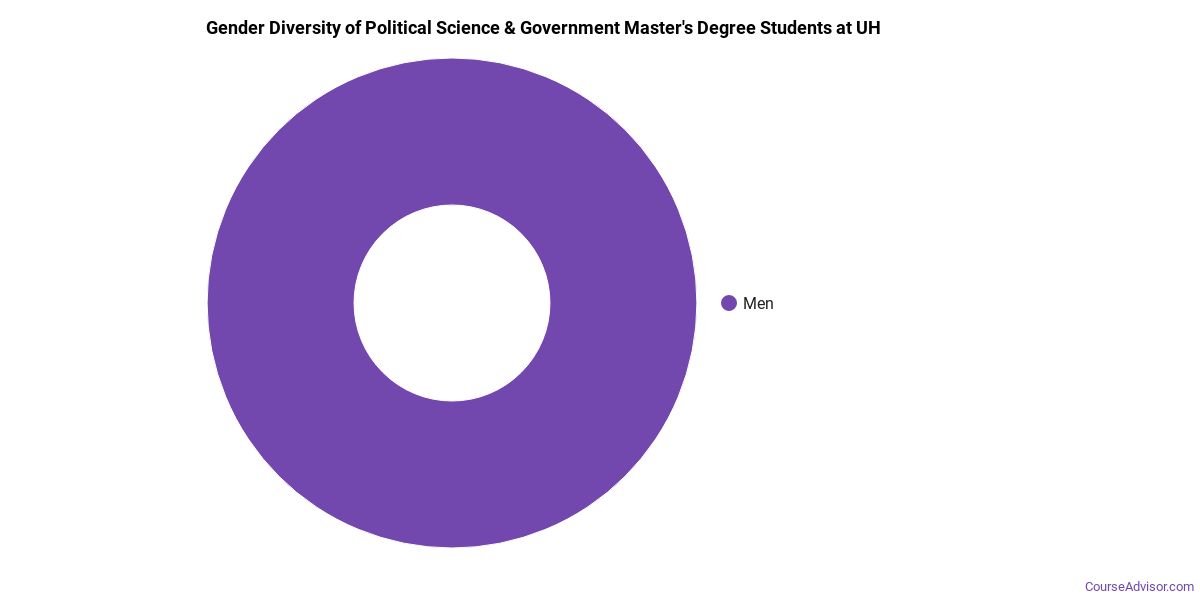
Political Science & Government Master’s Program at University of Houston
Of the 2 master’s political science & government degrees awarded at University of Houston, 50% were women (1) and 50% were men (1).
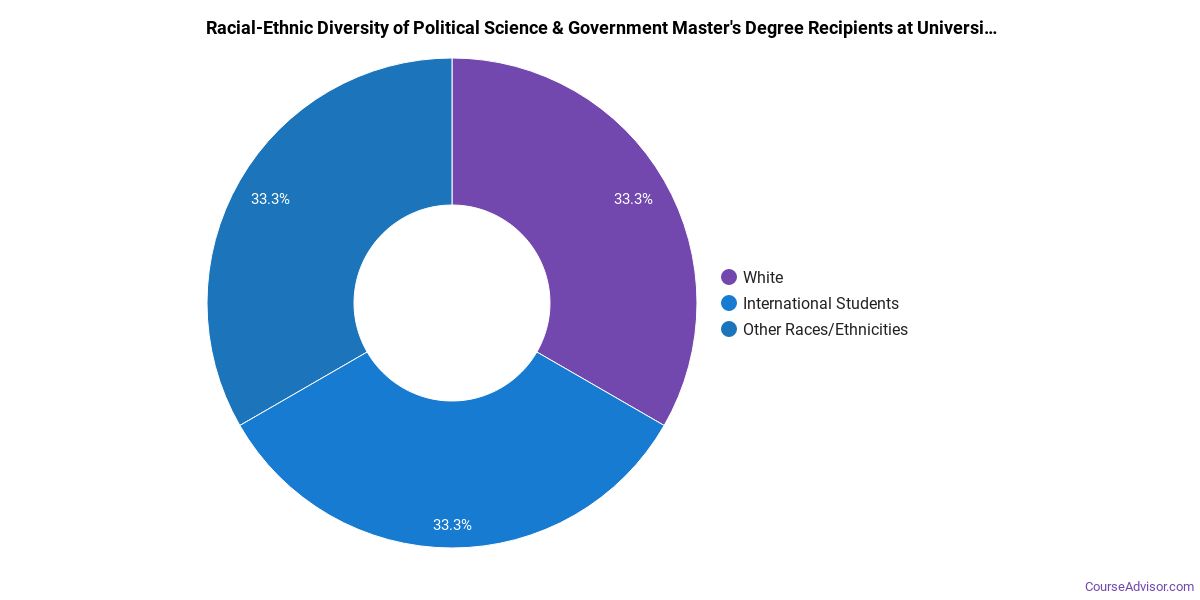
The following table and chart show the race/ethnicity of Political Science & Government master’s degree recipients at University of Houston.
| Race / Ethnicity | Number of Graduates |
|---|---|
| International (Nonresident) | 2 |
Political Science & Government Doctoral Program at University of Houston
Among the 3 doctoral political science & government degrees awarded at University of Houston, 67% were women (2) and 33% were men (1).

The following table and chart show the race/ethnicity of Political Science & Government doctoral degree recipients at University of Houston.
| Race / Ethnicity | Number of Graduates |
|---|---|
| White | 1 |
| Black / African American | 1 |
| International (Nonresident) | 1 |

Minority students account for 33% of Political Science & Government doctoral degree recipients at University of Houston, above the national average of 16%.*
*The racial-ethnic minorities figure is the total number of graduates minus White, international (nonresident), and unknown-race graduates.
More Specific Political Science & Government Concentrations at University of Houston
The Political Science & Government program at University of Houston breaks down into more specific concentrations:
| Concentration | Graduates |
|---|---|
| Political Science | 207 |
Best-Paid Careers for Political Science & Government Graduates
Those who complete Political Science & Government program at University of Houston pursue many career paths. Here are the highest-paying careers for Political Science & Government graduates, ordered by median annual salary:
| Occupation | Nationwide Median Wage |
|---|---|
| Wind Energy Development Managers | $169,952 |
| Loss Prevention Managers | $165,723 |
| Wind Energy Operations Managers | $122,567 |
| Compliance Managers | $117,178 |
| Brownfield Redevelopment Specialists and Site Managers | $99,321 |
| Managers, All Other | $95,684 |
| Environmental Economists | $86,726 |
| Secondary School Teachers, Except Special and Career/Technical Education | $77,927 |
| Regulatory Affairs Managers | $77,828 |
| Economists | $73,611 |
References
- IPEDS — Integrated Postsecondary Education Data System
- U.S. Department of Education — College Scorecard
- O*NET Online (Bureau of Labor Statistics)
- National Center for Education Statistics
More about our data sources and methodologies.
Course Advisor provides higher-education, college and university, degree, program, career, salary, and other helpful information to students, faculty, institutions, and other internet audiences. Presented information and data are subject to change. Inclusion on this website does not imply or represent a direct relationship with the company, school, or brand. Information, though believed correct at time of publication, may not be correct, and no warranty is provided. Contact the schools to verify any information before relying on it. Financial aid may be available for those who qualify. The displayed options may include sponsored or recommended results, not necessarily based on your preferences.
© Course Advisor – All Rights Reserved.