Find Schools

Study Area & Zipcode

University of Arizona

Find Schools Near

University of Arizona Overview

University of Arizona is a public institution located in Tucson, Arizona. Tucson is a great location for students who prefer city over country life.

What Is University of Arizona Known For?

8,210 Undergraduate Awards
$40,854 Avg Cost After Aid
85% Acceptance Rate
  • The doctor's degree is the highest award offered at University of Arizona.
  • For the 2019-2020 academic year, 78% of the faculty were full-time.
  • After graduation, University of Arizona bachelor's degree recipients go on to jobs where they make $55,205 a year. That's about 35% more than their peers at other schools.

Best Schools

University of Arizona Rankings

These rankings may look different from those published by other outlets, because we use an outcomes-based approach rather than a subjective one. We get our data from a number of places, including the Integrated Postsecondary Education Data System (IPEDS) and the College Scorecard. For more information, check out our rankings and methodology page.

Program Level Awards

These are highlights of some of the most noteworthy awards granted to specific programs at University of Arizona.

Rank Ranking Name Share
#1 Best Doctor’s Degree Schools Tweet It - Post It
#2 Best Atmospheric Sciences Master’s Degree Schools Tweet It - Post It
#3 Best Materials Sciences Master’s Degree Schools Tweet It - Post It
#4 Best Physics Master’s Degree Schools Tweet It - Post It
#8 Best Physical Sciences Master’s Degree Schools Tweet It - Post It
#19 Best Entrepreneurial Studies Bachelor’s Degree Schools Tweet It - Post It
#21 Best Management Information Systems Bachelor’s Degree Schools Tweet It - Post It
#74 Best Communication & Media Studies Bachelor’s Degree Schools Tweet It - Post It
#100 Best Communication & Journalism Bachelor’s Degree Schools Tweet It - Post It
#165 Best Business, Management & Marketing Bachelor’s Degree Schools Tweet It - Post It

Awards From Around the Web

The following table lists some notable awards University of Arizona has earned from around the web.

Rank Ranking Name Source
#1 Best Linguistics and Anthropology Graduate Degree Schools College Factual
#9 Best Management Information Systems Schools College Factual
#17 Best Mental & Social Health Services Schools College Factual
#45 Best Communication & Journalism Schools College Factual
#98 Best Business, Management & Marketing Schools College Factual
#153 Best Health Professions Schools College Factual

Where Is University of Arizona?

undefined

Contact details for University of Arizona are given below.

Contact Details
Address: 1401 E University, Tucson, AZ 85721-0066
Phone: 520-621-2211
Website: www.arizona.edu
Facebook: https://www.facebook.com/uarizona
Twitter: http://twitter.com/uofa

How Do I Get Into University of Arizona?

You can apply to University of Arizona online at: https://slate.admissions.arizona.edu/apply

Admission Requirements for University of Arizona

Submission Required?
High School GPA required
High School Rank considered but not required
High School Transcript required
College Prep Program recommended
Recommendations considered but not required
SAT or ACT Scores considered but not required
TOEFL considered but not required

How Hard Is It To Get Into University of Arizona?

85% Acceptance Rate
58% Of Accepted Are Women
46% Submit SAT Scores
With an acceptance rate of 85%, University of Arizona is fairly easy to get into, but you must be sure to submit the required materials.

Approximately 42% of accepted students are men and 58% are women. The acceptance rate for men is 83%, and the acceptance rate for women is 87%.

Average Test Scores

About 46% of students accepted to University of Arizona submitted their SAT scores. When looking at the 25th through the 75th percentile, SAT Evidence-Based Reading and Writing scores ranged between 550 and 660. Math scores were between 540 and 690.

SAT Reading and Writing Scores for University of Arizona  ( 550 to 660 )
200
800

SAT Math Scores for University of Arizona  ( 540 to 690 )
200
800
University of Arizona received ACT scores from 49% of accepted students. When looking at the 25th through the 75th percentile, ACT English scores ranged between 20 and 30. Math scores were between 20 and 28. Composite scores were between 21 and 29.

ACT English Scores for University of Arizona  ( 20 to 30 )
1
36
ACT Math Scores for University of Arizona  ( 20 to 28 )
1
36
ACT Composite Scores for University of Arizona  ( 21 to 29 )
1
36

Can I Afford University of Arizona?

$40,854 Net Price
30% Take Out Loans
5.4% Loan Default Rate
The overall average net price of University of Arizona is $40,854. The affordability of the school largely depends on your financial need since net price varies by income group.

The net price is calculated by adding tuition, room, board and other costs and subtracting financial aid.

Student Loan Debt

While almost two-thirds of students nationwide take out loans to pay for college, the percentage may be quite different for the school you plan on attending. At University of Arizona, approximately 30% of students took out student loans averaging $7,592 a year. That adds up to $30,368 over four years for those students.

The student loan default rate at University of Arizona is 5.4%. This is significantly lower than the national default rate of 10.1%, which is a good sign that you'll be able to pay back your student loans.

University of Arizona Undergraduate Student Diversity

28,556 Full-Time Undergraduates
56% Women
43% Racial-Ethnic Minorities*
There are 35,357 undergraduate students at University of Arizona, with 28,556 being full-time and 6,801 being part-time.

undefined

There are also 10,244 graduate students at the school.

Gender Diversity

Of the 28,556 full-time undergraduates at University of Arizona, 44% are male and 56% are female.

undefined

Racial-Ethnic Diversity

The racial-ethnic breakdown of University of Arizona students is as follows.

undefined
Race/Ethnicity Number of Grads
Asian 1,548
Black or African American 991
Hispanic or Latino 7,949
White 14,095
International Students 1,551
Other Races/Ethnicities 2,422

Geographic Diversity

Arizona students aren't the only ones who study at University of Arizona. At this time, all 50 states are represented by the student population at the school.

At this time, 50 states are represented by the student population at the school.

Over 118 countries are represented at University of Arizona. The most popular countries sending students to the school are China, India, and Saudi Arabia.

Online Learning at University of Arizona

7,280 Took All Classes Online
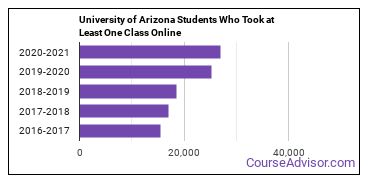
25,329 Took At Least One Class Online
29.9% Avg Growth Over 4 Years
In 2019-2020, 25,329 students took at least one online class at the school.

The following chart shows how the online learning population at University of Arizona has changed over the last few years.
undefined

This school is the 19th most popular in Arizona for online learning according to the online graduations recorded by the Department of Education for the academic year 2019-2020.

Online Affordability Rankings of University of Arizona

During the most recent year for which we have data, the full-time undergraduate tuition at University of Arizona was $12,716 for in-state students. Out-of-state students paid $36,743. The following table shows how University of Arizona is ranked for affordability for both in-state and out-of-state students among colleges and universities that are not mostly online.

Major Tuition for In-State Students Tuition for Out-of-State Students
Non-Professional General Legal Studies #1 #4
Architecture (Other) #1 #1
Real Estate Development #1 #1
Legal Professions (Other) #1 #10
Cell Biology & Anatomical Sciences #1 #1
Educational Assessment #1 #1
Architecture & Related Services #1 #4
Philosophy, Politics, and Economics #1 #1
Materials Sciences #1 #1
Chemical Engineering #4 #4
Physics #4 #4
Nutrition Science #4 #4
Military Technologies & Applied Sciences #6 #12
Intelligence & Command Control Operations #6 #12
Computer Software & Applications #7 #40
International Studies #7 #13
Science Technologies / Technicians #7 #13
Other Science Technologies/Technicians #7 #10
Natural Resources Conservation #10 #20
Romance Languages #10 #19
Entrepreneurial Studies #10 #30
Natural Resources & Conservation #13 #25
Geography & Cartography #13 #13
Physical Sciences #13 #13
Legal Research #13 #15
Philosophy #16 #22
Foreign Languages & Linguistics #16 #31
Food, Nutrition & Related Services #16 #28
Systems Engineering #16 #19
International Relations & National Security #19 #25
Legal Professions #19 #80
Engineering #19 #25
Interdisciplinary Studies #22 #37
Ethnic Studies #22 #28
Management Sciences & Quantitative Methods #25 #62
Mental & Social Health Services #28 #37
Area, Ethnic, Culture, & Gender Studies #28 #43
Industrial Engineering #40 #46
Biological & Biomedical Sciences #43 #46
Philosophy & Religious Studies #46 #131
General Engineering #48 #54
Human Development & Family Studies #51 #93
Accounting #55 #157
Electrical Engineering #58 #76
Political Science & Government #58 #97
Computer Information Systems #63 #113
Human Resource Management #66 #215
Engineering-Related Fields #67 #88
Mechanical Engineering #67 #72
History #75 #119
History #75 #119

Online Growth Rankings of University of Arizona

The average growth rate over the last four years of online students at University of Arizona was 29.9%. This is the #877 largest growth rate of all schools that are only partially online. This refers to all students at University of Arizona regardless of major.

The following table shows the 1-year growth rate of University of Arizona majors that offer at least one online course. This table only includes majors with positive growth.

Major 1-Year Growth Rate
Accounting 14%
Business, Management & Marketing 8%
Entrepreneurial Studies 39%
Family, Consumer & Human Sciences 8%
Food, Nutrition & Related Services 11%
Health & Medical Administrative Services 74%
Health Professions 4%
Homeland Security, Law Enforcement & Firefighting 6%

The table below shows how the average growth rate over 4 years at University of Arizona ranks compared to all other partially online schools that offer a specific major. Note that the majors may or may not be offered online at University of Arizona.

Major Growth Rate Rank
Philosophy, Politics, and Economics #1
Architecture (Other) #1
Real Estate Development #1
Mining Engineering #1
Physics #3
Cell Biology & Anatomical Sciences #4
Other Science Technologies/Technicians #4
Statistics #4
Materials Sciences #4
Chemical Engineering #4
Science Technologies / Technicians #5
Ethnic Studies #6
Nutrition Science #7
Military Technologies & Applied Sciences #8
Intelligence & Command Control Operations #8
Non-Professional General Legal Studies #10
Food, Nutrition & Related Services #10
Area, Ethnic, Culture, & Gender Studies #12
Architecture & Related Services #13
International Studies #13
Other Engineering #13
Mechanical Engineering #13
Industrial Engineering #13
Educational Assessment #15
Philosophy #16
Systems Engineering #16
Natural Resources Conservation #18
Legal Professions (Other) #19
Romance Languages #19
International Relations & National Security #20
General Engineering #21
Other Health Professions #23
Natural Resources & Conservation #24
Electrical Engineering #25
Management Information Systems #25
International Business #26
Interdisciplinary Studies #29
Mathematics & Statistics #31
Political Science & Government #32
Geography & Cartography #33
Teaching English or French #33
Legal Research #34
Library Science #37
Library & Information Science #37
Foreign Languages & Linguistics #37
Biological & Biomedical Sciences #40
Physical Sciences #40
Finance & Financial Management #42
History #42
History #42
Engineering-Related Fields #46
Philosophy & Religious Studies #53
Management Sciences & Quantitative Methods #53
Writing Studies #54
Communication & Media Studies #58
Computer Software & Applications #59
Entrepreneurial Studies #65
Clinical, Counseling & Applied Psychology #69
Mental & Social Health Services #83
English Language & Literature #85
Engineering #93
Human Development & Family Studies #103
General Psychology #109
Instructional Media Design #111
Public Health #112
Communication & Journalism #113
Legal Professions #114
Family, Consumer & Human Sciences #127
Engineering Technologies #128
Information Technology #135
Computer Information Systems #144
Special Education #145
Teacher Education Subject Specific #151
Social Sciences #163
Psychology #178
Educational Administration #180
Multi / Interdisciplinary Studies #217
Accounting #238
Health & Medical Administrative Services #326
Nursing #351
Computer & Information Sciences #370
Homeland Security, Law Enforcement & Firefighting #386

When we speak of partially online, we are referring to schools whose online population is less than 50% of its total student body. Mostly online refers to those with online populations greater than or equal to 50%.

University of Arizona Undergraduate Concentrations

The table below shows the number of awards for each concentration.

Major Basic Certificate Bachelor’s Graduate Certificate Master’s Doctor’s TOTAL
General Psychology 0 473 0 14 0 487
Business Administration & Management 3 234 0 218 11 466
Nursing 0 146 10 197 108 461
Public Health 0 221 9 195 18 443
Communication & Media Studies 0 296 0 8 4 308
Physiology & Pathology Sciences 0 279 0 11 15 305
Interdisciplinary Studies 0 294 0 0 0 294
Political Science & Government 0 229 0 4 5 238
Management Information Systems 0 219 14 0 0 233
Computer Science 0 207 0 19 5 231
Accounting 3 176 17 32 0 228
Marketing 0 201 0 13 0 214
Computer Information Systems 0 90 0 120 0 210
Finance & Financial Management 8 198 0 0 0 206
Economics 0 166 0 33 6 205
Legal Professions (Other) 0 183 11 0 0 194
Electrical Engineering 0 94 0 79 20 193
Medicine 0 0 0 0 193 193
Teacher Education Grade Specific 0 145 13 15 0 173
Mental & Social Health Services 0 130 0 41 0 171
Nutrition Science 0 161 0 3 4 168
Criminal Justice & Corrections 0 168 0 0 0 168
Pharmacy/Pharmaceutical Sciences 0 41 0 2 119 162
Physics 0 65 7 54 36 162
Human Resource Management 0 155 0 0 0 155
Romance Languages 0 129 0 16 3 148
Natural Resources Conservation 2 102 0 19 21 144
Cell Biology & Anatomical Sciences 0 114 0 16 7 137
Mechanical Engineering 0 117 0 16 4 137
Child Development & Psychology 0 118 0 0 16 134
Neurobiology & Neurosciences 0 121 0 0 4 125
Intelligence & Command Control Operations 59 58 0 0 0 117
Writing Studies 19 69 0 21 4 113
Computer Software & Applications 0 110 0 0 0 110
Special Education 0 28 16 62 4 110
Law 0 0 0 0 110 110
Other Science Technologies/Technicians 0 107 0 0 0 107
Human Development & Family Studies 0 103 0 0 0 103
Fine & Studio Arts 0 82 0 17 0 99
Communication Sciences 0 51 0 35 11 97
Mathematics 0 84 0 5 8 97
Journalism 0 83 0 11 0 94
Chemical Engineering 0 86 0 5 3 94
Music 0 42 0 26 25 93
General Biology 0 92 0 0 0 92
Library & Information Science 0 0 19 73 0 92
General English Literature 0 86 0 1 4 91
Non-Professional General Legal Studies 0 0 0 89 0 89
Urban & Regional Planning 0 76 0 10 0 86
Entrepreneurial Studies 3 64 0 18 0 85
Public Administration 0 58 0 27 0 85
Biochemistry, Biophysics & Molecular Biology 0 71 0 5 7 83
Geography & Cartography 2 28 10 37 5 82
Educational Assessment 0 77 2 0 0 79
Systems Engineering 1 54 1 13 4 73
Area Studies 0 44 0 18 11 73
Anthropology 0 53 0 7 13 73
Geological & Earth Sciences 1 38 1 25 7 72
History 0 59 0 3 6 68
Sociology 0 53 0 2 10 65
General Education 0 0 0 59 3 62
Health & Physical Education 62 0 0 0 0 62
Architectural Sciences & Technology 0 44 0 17 0 61
Chemistry 0 42 0 6 12 60
Biomedical Engineering 0 42 0 13 3 58
Film, Video & Photographic Arts 0 58 0 0 0 58
Educational Administration 0 0 5 30 20 55
Microbiological Sciences & Immunology 0 46 3 4 1 54
Business/Managerial Economics 0 52 0 0 0 52
International Studies 0 24 3 23 0 50
Drama & Theater Arts 0 45 0 4 0 49
Philosophy 0 38 0 4 5 47
Statistics 0 26 4 13 3 46
Industrial Engineering 0 36 0 9 0 45
Mining Engineering 0 15 15 8 7 45
International Relations & National Security 0 0 0 45 0 45
Astronomy & Astrophysics 0 19 0 10 15 44
Teacher Education Subject Specific 0 17 2 13 11 43
Applied Mathematics 0 0 0 39 4 43
Ecology, Evolution & Systematics Biology 0 27 0 6 7 40
Ethnic Studies 4 24 0 4 8 40
Dance 0 35 0 4 0 39
Civil Engineering 0 32 0 2 3 37
Linguistics & Comparative Literature 0 22 0 9 6 37
Legal Research 0 0 18 13 5 36
Management Sciences & Quantitative Methods 0 0 0 34 0 34
Agricultural Public Services 0 33 0 0 0 33
Clinical, Counseling & Applied Psychology 0 0 14 11 8 33
Engineering-Related Fields 0 7 3 19 0 29
General Engineering 0 0 0 29 0 29
Philosophy, Politics, and Economics 0 29 0 0 0 29
Teaching English or French 0 0 6 6 16 28
Animal Science 0 25 0 2 0 27
Materials Sciences 0 20 0 4 3 27
Aerospace & Aeronautical Engineering 0 18 0 6 2 26
Biological Engineering 0 11 0 9 5 25
Architecture (Other) 0 24 0 0 0 24
Agricultural Economics & Business 3 19 1 0 0 23
Liberal Arts General Studies 0 22 0 0 0 22
Classical Languages & Literature 0 14 0 7 0 21
Slavic, Baltic & Albanian Languages 0 15 0 5 0 20
Other Agriculture 0 19 0 0 0 19
Biotechnology 0 0 0 19 0 19
Health & Medical Administrative Services 0 0 0 19 0 19
Other Education 0 18 0 0 0 18
Plant Sciences 0 10 0 2 4 16
Environmental Engineering 0 5 0 6 4 15
Information Science 0 0 0 10 4 14
Germanic Languages 0 10 0 3 0 13
Wildlife Management 11 0 0 0 0 11
Religious Studies 0 11 0 0 0 11
Architectural Engineering 0 10 0 0 0 10
Health/Medical Prep Programs 0 0 0 10 0 10
Human Services 0 10 0 0 0 10
Real Estate Development 0 0 0 9 0 9
Food, Nutrition & Related Services 0 2 1 6 0 9
Sustainability Science 0 0 0 9 0 9
Atmospheric Sciences & Meteorology 0 0 0 5 4 9
International Business 0 0 8 0 0 8
Middle Eastern Semitic Languages 0 8 0 0 0 8
Medical Science 0 0 0 7 1 8
Public Policy 0 0 0 8 0 8
Zoology 1 0 0 3 3 7
Information Technology 0 0 6 0 0 6
Other Engineering 0 0 6 0 0 6
General Social Sciences 0 0 6 0 0 6
Pharmacology & Toxicology 0 0 0 4 1 5
Public Relations & Advertising 0 0 4 0 0 4
Instructional Media Design 0 0 1 3 0 4
Engineering Physics 0 4 0 0 0 4
Family & Consumer Economics 0 0 0 1 3 4
Natural Sciences 0 0 0 3 1 4
Biomathematics & Bioinformatics 0 3 0 0 0 3
Clinical/Medical Laboratory Science 0 0 3 0 0 3
Agricultural Production 0 2 0 0 0 2
Genetics 0 0 0 1 1 2
Molecular Medicine 0 0 0 0 2 2
General Business/Commerce 0 2 0 0 0 2
Engineering-Related Technologies 0 2 0 0 0 2
Allied Health Professions 0 2 0 0 0 2
Linguistics and Anthropology 0 0 0 0 2 2
Botany/Plant Biology 0 0 0 0 1 1
Other Health Professions 0 0 1 0 0 1
Rehabilitation & Therapeutic Professions 0 0 0 0 1 1
Cultural Studies & Analysis 0 0 1 0 0 1
Museum Studies 0 0 1 0 0 1
Other Multi/Interdisciplinary Studies 0 0 0 1 0 1
Design & Applied Arts 1 0 0 0 0 1
Food Science Technology 0 0 0 0 0 0
General Architecture 0 0 0 0 0 0
Landscape Architecture 0 0 0 0 0 0
Biological & Biomedical Sciences (Other) 0 0 0 0 0 0
Communication & Journalism (Other) 0 0 0 0 0 0
Radio, Television & Digital Communication 0 0 0 0 0 0
Multilingual Education 0 0 0 0 0 0
Student Counseling 0 0 0 0 0 0
Agricultural Engineering 0 0 0 0 0 0
Construction Engineering 0 0 0 0 0 0
Geoscience Engineering 0 0 0 0 0 0
Ethnic, Culture, & Gender Studies (Other) 0 0 0 0 0 0
Iranian & Persian Languages 0 0 0 0 0 0
Legal Support Services 0 0 0 0 0 0
Gerontology 0 0 0 0 0 0
Historic Preservation 0 0 0 0 0 0
Natural Resource Management 0 0 0 0 0 0
Archeology 0 0 0 0 0 0
General Visual & Performing Arts 0 0 0 0 0 0
Other Visual Art 0 0 0 0 0 0
TOTAL 183 8,027 242 2,231 1,010 11,693

References

*The racial-ethnic minorities count is calculated by taking the total number of students and subtracting white students, international students, and students whose race/ethnicity was unknown. This number is then divided by the total number of students at the school to obtain the racial-ethnic minorities percentage.

More about our data sources and methodologies.

Featured Schools

Find Schools Near You

Our free school finder matches students with accredited colleges across the U.S.