Geography & Cartography at The University of Montana
What traits are you looking for in a school for Geography & Cartography, take a look at what The University of Montana. The following information will help you decide if it is a good fit for you.
The University of Montana is located in Missoula, MT.
For the most recent IPEDS reporting year, 28 geography & cartography degrees were awarded at The University of Montana.
Featured schools near , edit
Online Class Availability at The University of Montana
Online coursework is an option at The University of Montana. Of 10,811 students, 2,398 (22%) studied exclusively online and 3,174 (29%) took at least some classes online.
Geography & Cartography Rankings at The University of Montana
Use these rankings to compare The University of Montana’s Geography & Cartography program against peer institutions.
Bachelor’s-Level Rankings
| Ranking | Scope | Rank |
|---|---|---|
| Best Schools (Quality) | Montana | #1 of 1 |
| Best Value | Montana | #1 of 1 |
| Best Schools (Quality) | Rocky Mountains (Region) | #11 of 15 |
| Best Value | Rocky Mountains (Region) | #12 of 15 |
| Best Value | Nationwide | #88 of 151 |
| Best Schools (Quality) | Nationwide | #91 of 152 |
Master’s-Level Rankings
| Ranking | Scope | Rank |
|---|---|---|
| Best Schools (Quality) | Montana | #1 of 1 |
| Best Value | Montana | #1 of 1 |
| Best Schools (Quality) | Rocky Mountains (Region) | #11 of 15 |
| Best Value | Rocky Mountains (Region) | #12 of 15 |
| Best Value | Nationwide | #88 of 151 |
| Best Schools (Quality) | Nationwide | #91 of 152 |
Student Demographics & Diversity
Below you’ll find the composition of Geography & Cartography graduates at The University of Montana, broken down by degree level.
Looking at the program as a whole, Geography & Cartography graduates at The University of Montana are 32% women (9) and 68% men (19).
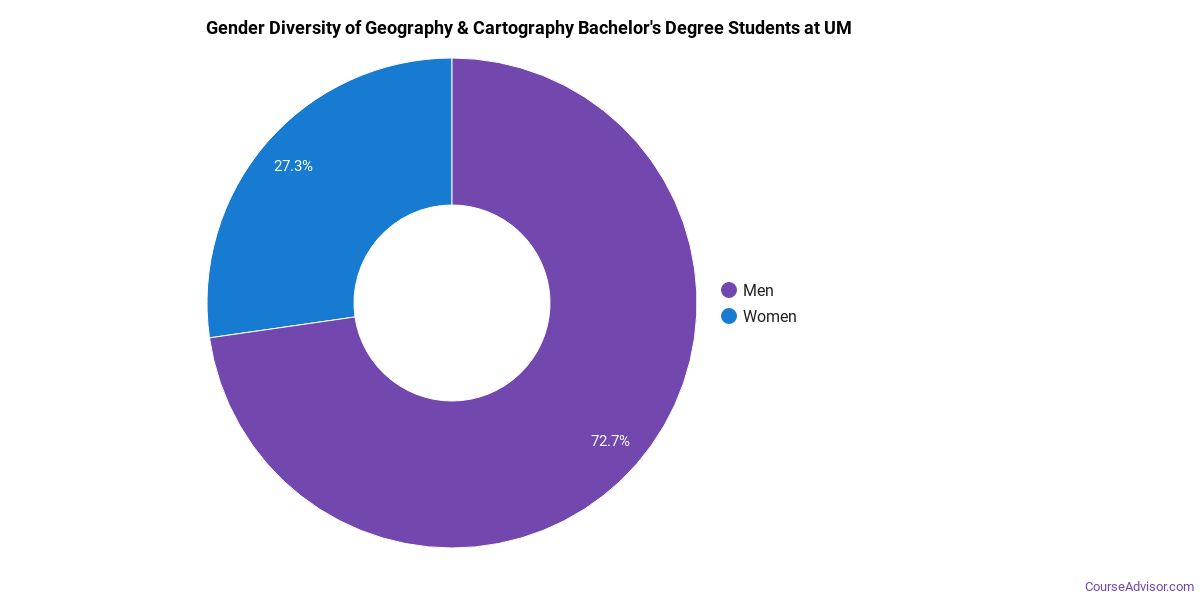
Geography & Cartography Bachelor’s Program at The University of Montana
Of the 4 bachelor’s geography & cartography graduates at The University of Montana, 25% were women (1) and 75% were men (3).
The following table and chart show the race/ethnicity of Geography & Cartography bachelor’s degree recipients at The University of Montana.
| Race / Ethnicity | Number of Graduates |
|---|---|
| White | 2 |
| Hispanic / Latino | 1 |
| Two or More Races | 1 |
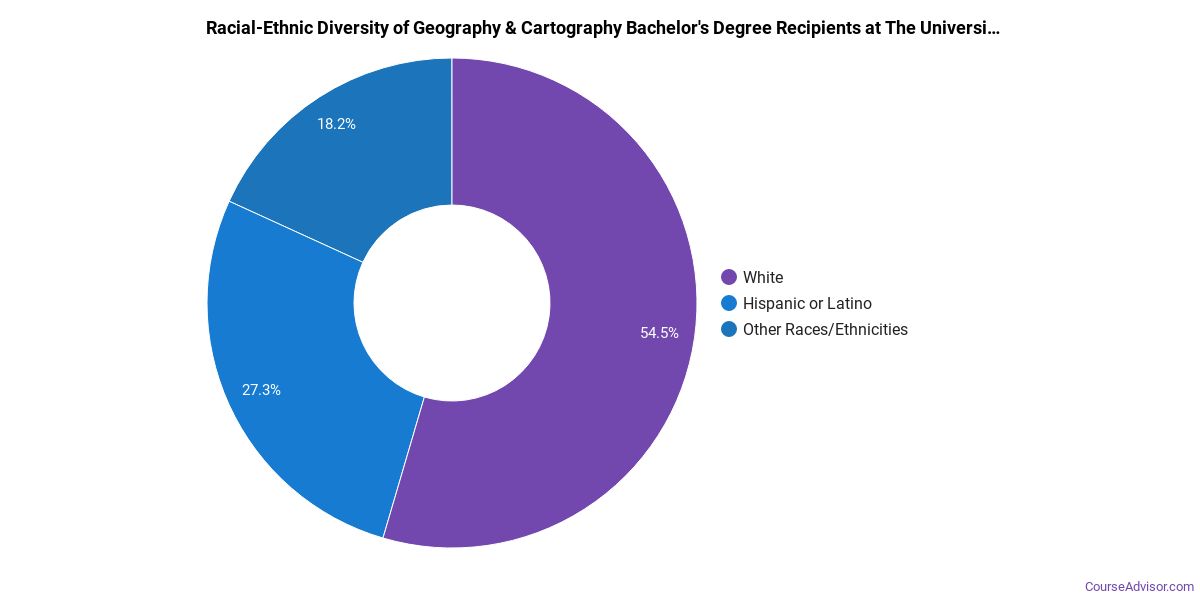
Minority students account for 50% of Geography & Cartography bachelor’s degree recipients at The University of Montana, above the national average of 30%.*
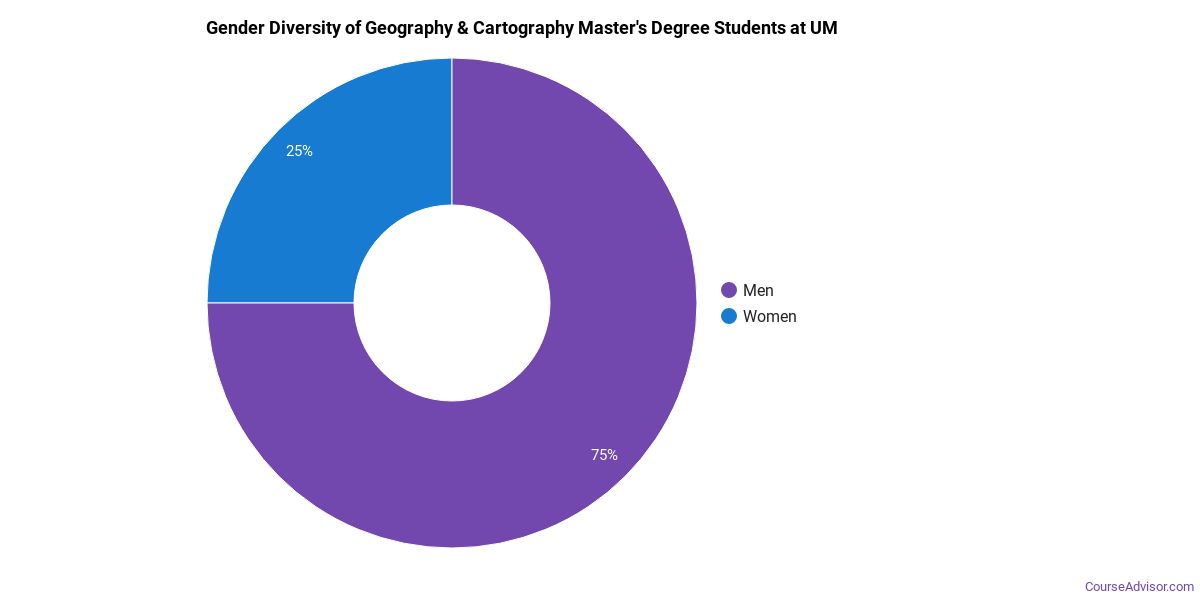
Geography & Cartography Master’s Program at The University of Montana
Of the 3 master’s geography & cartography graduates at The University of Montana, 33% were women (1) and 67% were men (2).
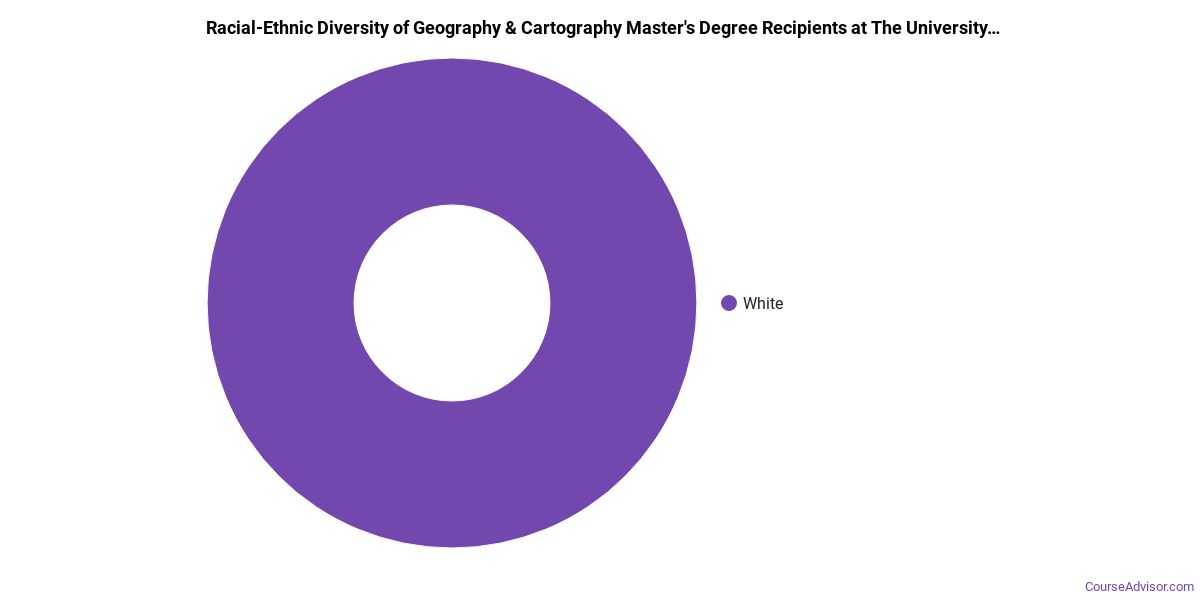
The following table and chart show the race/ethnicity of Geography & Cartography master’s degree recipients at The University of Montana.
| Race / Ethnicity | Number of Graduates |
|---|---|
| White | 3 |
*The racial-ethnic minorities figure is the total number of graduates minus White, international (nonresident), and unknown-race graduates.
More Specific Geography & Cartography Concentrations at The University of Montana
The Geography & Cartography program at The University of Montana breaks down into more specific concentrations:
| Concentration | Graduates |
|---|---|
| Geography | 7 |
| Geographic Information Science | 21 |
Highest-Paying Careers for Geography & Cartography Graduates
Those who complete Geography & Cartography program at The University of Montana go on to a range of careers. Below are the top-paying careers for Geography & Cartography graduates, ordered by median annual salary:
| Occupation | Nationwide Median Wage |
|---|---|
| Wind Energy Development Managers | $169,952 |
| Loss Prevention Managers | $165,723 |
| Surveying and Mapping Technicians | $123,658 |
| Wind Energy Operations Managers | $122,567 |
| Compliance Managers | $117,178 |
| Brownfield Redevelopment Specialists and Site Managers | $99,321 |
| Managers, All Other | $95,684 |
| Regulatory Affairs Managers | $77,828 |
| Geographers | $77,391 |
| Cartographers and Photogrammetrists | $56,771 |
References
- IPEDS — Integrated Postsecondary Education Data System
- U.S. Department of Education — College Scorecard
- O*NET Online (Bureau of Labor Statistics)
- National Center for Education Statistics
More about our data sources and methodologies.
Course Advisor provides higher-education, college and university, degree, program, career, salary, and other helpful information to students, faculty, institutions, and other internet audiences. Presented information and data are subject to change. Inclusion on this website does not imply or represent a direct relationship with the company, school, or brand. Information, though believed correct at time of publication, may not be correct, and no warranty is provided. Contact the schools to verify any information before relying on it. Financial aid may be available for those who qualify. The displayed options may include sponsored or recommended results, not necessarily based on your preferences.
© Course Advisor – All Rights Reserved.