Business Administration & Management at Sitting Bull College
If you are interested in studying Business Administration & Management, you may want to check out the program at Sitting Bull College. We’ve gathered the following information to help you decide.
Sitting Bull College sits in Fort Yates, ND.
For the most recent IPEDS reporting year, 15 business administration & management degrees were awarded at Sitting Bull College.
Featured schools near , edit
Studying Online at Sitting Bull College
Many students take online classes at Sitting Bull College. Of 309 students, 83 (27%) were enrolled entirely in distance education and 142 (46%) took at least some classes online.
Student Demographics & Diversity
Below you’ll find the diversity of Business Administration & Management graduates at Sitting Bull College, broken down by degree level.
Across all degree levels, Business Administration & Management graduates at Sitting Bull College are 93% women (14) and 7% men (1).
Business Administration & Management Associate’s Program at Sitting Bull College
Among the 7 associate’s business administration & management graduates at Sitting Bull College, 86% were women (6) and 14% were men (1).

The following table and chart show the race/ethnicity of Business Administration & Management associate’s degree recipients at Sitting Bull College.
| Race / Ethnicity | Number of Graduates |
|---|---|
| White | 1 |
| American Indian / Alaska Native | 6 |

Racial-ethnic minorities make up 86% of Business Administration & Management associate’s degree recipients at Sitting Bull College, higher than the national average of 51%.*
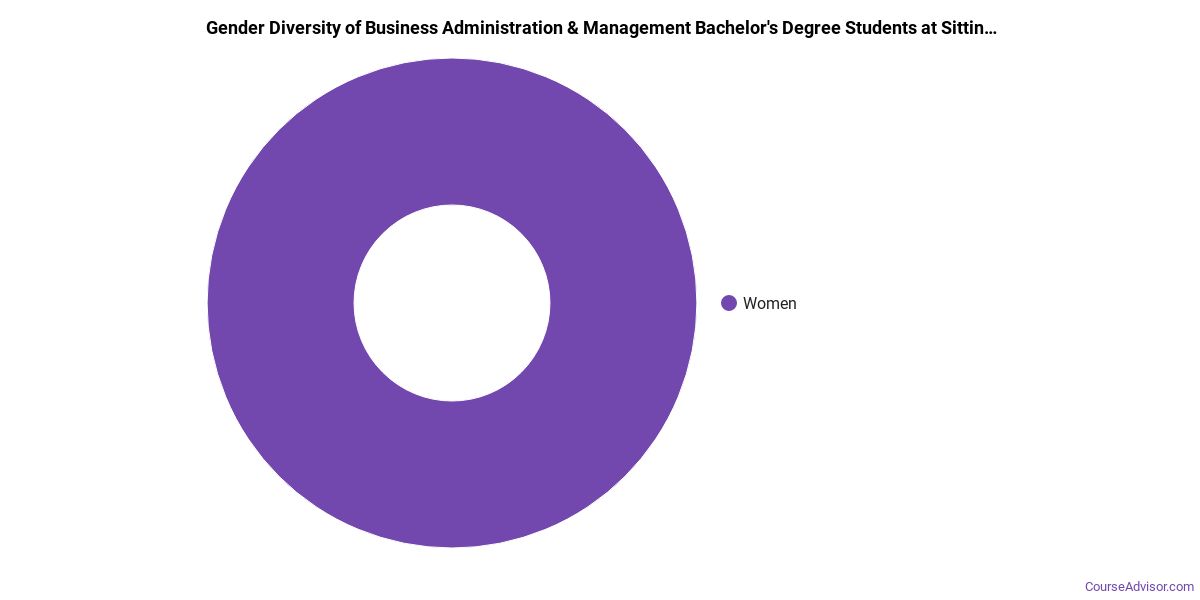
Business Administration & Management Bachelor’s Program at Sitting Bull College
Of the 3 bachelor’s business administration & management graduates at Sitting Bull College, 100% were women (3) and 0% were men (0).
The following table and chart show the race/ethnicity of Business Administration & Management bachelor’s degree recipients at Sitting Bull College.
| Race / Ethnicity | Number of Graduates |
|---|---|
| American Indian / Alaska Native | 3 |
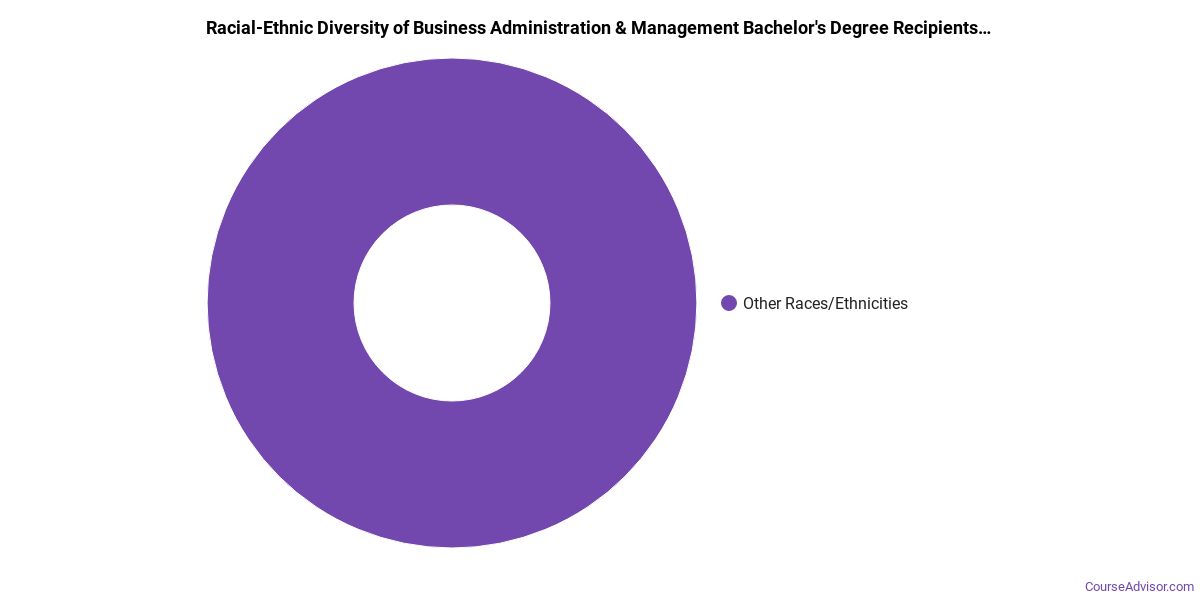
Minority students account for 100% of Business Administration & Management bachelor’s degree recipients at Sitting Bull College, higher than the national average of 41%.*
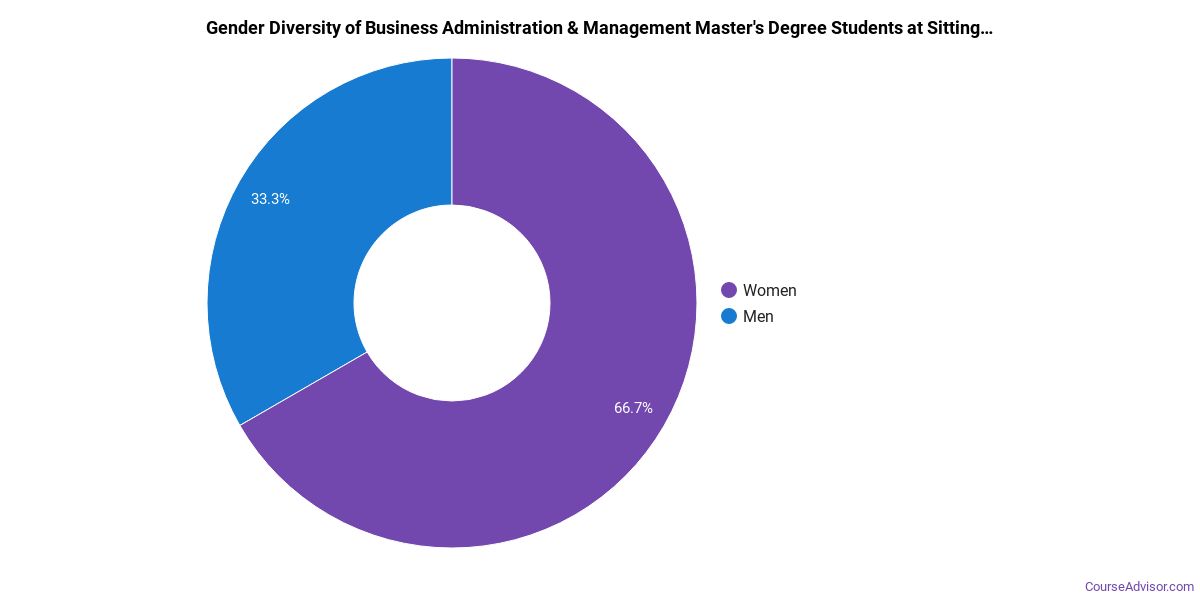
Business Administration & Management Master’s Program at Sitting Bull College
Of the 5 master’s business administration & management graduates at Sitting Bull College, 100% were women (5) and 0% were men (0).
The following table and chart show the race/ethnicity of Business Administration & Management master’s degree recipients at Sitting Bull College.
| Race / Ethnicity | Number of Graduates |
|---|---|
| American Indian / Alaska Native | 5 |
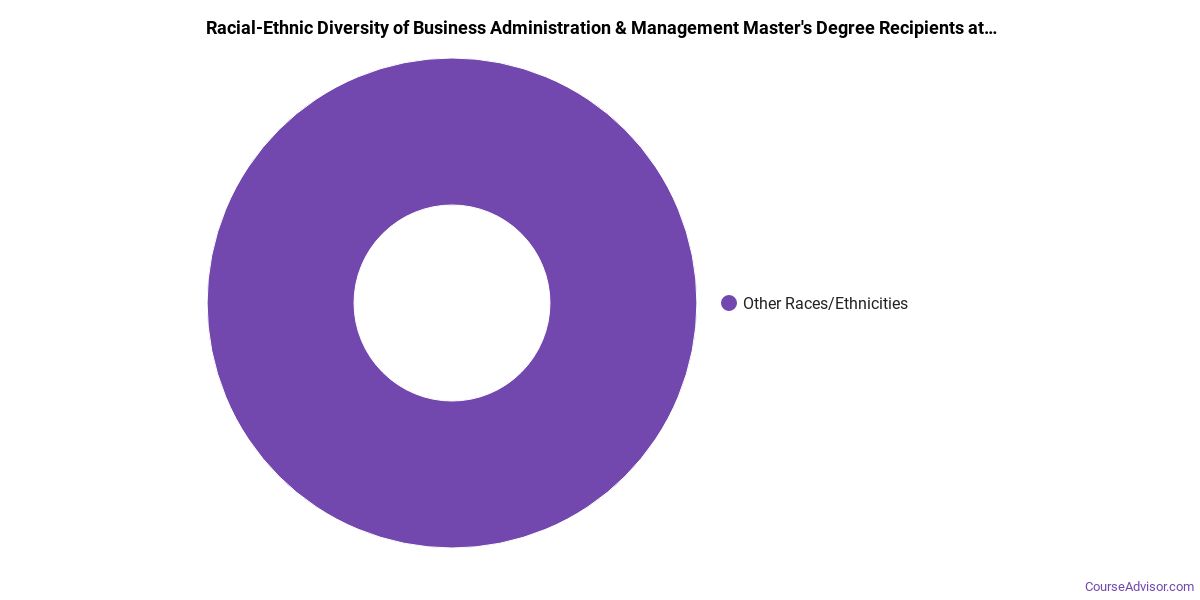
Minority students account for 100% of Business Administration & Management master’s degree recipients at Sitting Bull College, higher than the national average of 36%.*
*The racial-ethnic minorities figure is the total number of graduates minus White, international (nonresident), and unknown-race graduates.
More Specific Business Administration & Management Concentrations at Sitting Bull College
The Business Administration & Management program at Sitting Bull College offers more specialized concentrations:
| Concentration | Graduates |
|---|---|
| Business Administration & Management | 15 |
Highest-Paying Careers for Business Administration & Management Graduates
Students who finish Business Administration & Management program at Sitting Bull College pursue many career paths. Here are the top-paying careers for Business Administration & Management majors, ordered by median annual salary:
| Occupation | Nationwide Median Wage |
|---|---|
| Loss Prevention Managers | $165,723 |
| Geothermal Production Managers | $160,381 |
| Administrative Services Managers | $158,084 |
| Facilities Managers | $157,669 |
| Biomass Power Plant Managers | $146,025 |
| Supply Chain Managers | $138,103 |
| Medical and Health Services Managers | $129,557 |
| Security Management Specialists | $128,654 |
| Industrial Production Managers | $126,666 |
| Wind Energy Operations Managers | $122,567 |
References
- IPEDS — Integrated Postsecondary Education Data System
- U.S. Department of Education — College Scorecard
- O*NET Online (Bureau of Labor Statistics)
- National Center for Education Statistics
More about our data sources and methodologies.
Course Advisor provides higher-education, college and university, degree, program, career, salary, and other helpful information to students, faculty, institutions, and other internet audiences. Presented information and data are subject to change. Inclusion on this website does not imply or represent a direct relationship with the company, school, or brand. Information, though believed correct at time of publication, may not be correct, and no warranty is provided. Contact the schools to verify any information before relying on it. Financial aid may be available for those who qualify. The displayed options may include sponsored or recommended results, not necessarily based on your preferences.
© Course Advisor – All Rights Reserved.