Computer Science at San Francisco State University
If you are interested in studying Computer Science, consider the program at San Francisco State University. We’ve gathered the following information to help you decide.
San Francisco State University sits in San Francisco, CA.
During the most recent reporting year, 410 computer science degrees were granted at San Francisco State University.
Featured schools near , edit
Online Class Availability at San Francisco State University
Distance learning is available at San Francisco State University. Among 22,563 students, 1,684 (7%) were enrolled entirely in distance education and 12,257 (54%) took at least some classes online.
Computer Science Rankings at San Francisco State University
These rankings give you a sense of how San Francisco State University’s Computer Science program to other colleges that offer this major.
Bachelor’s-Level Rankings
| Ranking | Scope | Rank |
|---|---|---|
| Best Schools (Quality) | California | #27 of 103 |
| Best Schools (Quality) | Far Western (Region) | #36 of 142 |
| Best Value | California | #71 of 102 |
| Best Value | Far Western (Region) | #85 of 141 |
| Best Schools (Quality) | Nationwide | #161 of 637 |
| Best Value | Nationwide | #197 of 635 |
Master’s-Level Rankings
| Ranking | Scope | Rank |
|---|---|---|
| Best Schools (Quality) | California | #27 of 103 |
| Best Schools (Quality) | Far Western (Region) | #36 of 142 |
| Best Value | California | #71 of 102 |
| Best Value | Far Western (Region) | #85 of 141 |
| Best Schools (Quality) | Nationwide | #161 of 637 |
| Best Value | Nationwide | #197 of 635 |
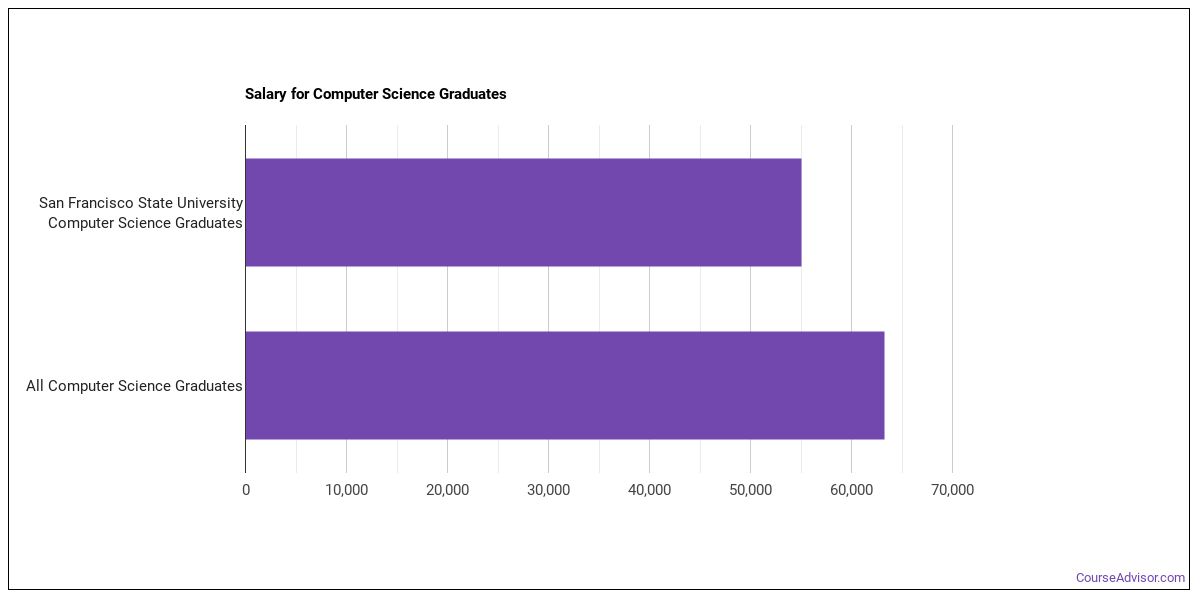
Earnings for Computer Science Graduates from San Francisco State University
Those who finish San Francisco State University’s Computer Science program earn at the following median levels (per the U.S. Department of Education’s College Scorecard):
| Years After Graduation | Median Earnings |
|---|---|
| 1 year | $55,088 |
| 2 years | $68,499 |
| 3 years | $89,726 |
| 4 years | $102,977 |
| 5 years | $112,049 |
Is this above or below average for the school? Four years out, Computer Science graduates from San Francisco State University take home a median $102,977, compared with $68,654 for all San Francisco State University graduates — about 50% higher than the school-wide median.

Median Debt at Graduation
The median debt for Computer Science graduates from San Francisco State University is $16,500.
Student Demographics & Diversity
The following sections describe the composition of Computer Science graduates at San Francisco State University, by degree type.
Looking at the program as a whole, Computer Science graduates at San Francisco State University are 19% women (77) and 81% men (333).
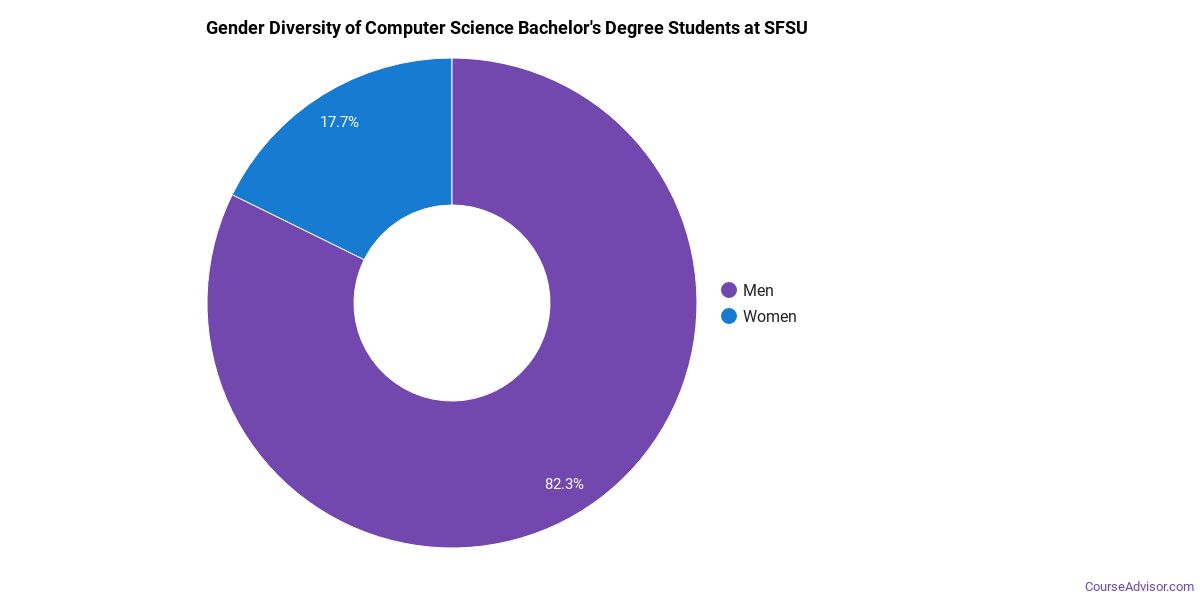
Computer Science Bachelor’s Program at San Francisco State University
Of the 369 bachelor’s computer science graduates at San Francisco State University, 17% were women (61) and 83% were men (308).
The following table and chart show the race/ethnicity of Computer Science bachelor’s degree recipients at San Francisco State University.
| Race / Ethnicity | Number of Graduates |
|---|---|
| White | 56 |
| Hispanic / Latino | 55 |
| Black / African American | 21 |
| Asian | 155 |
| American Indian / Alaska Native | 1 |
| Two or More Races | 18 |
| International (Nonresident) | 46 |
| Unknown | 17 |
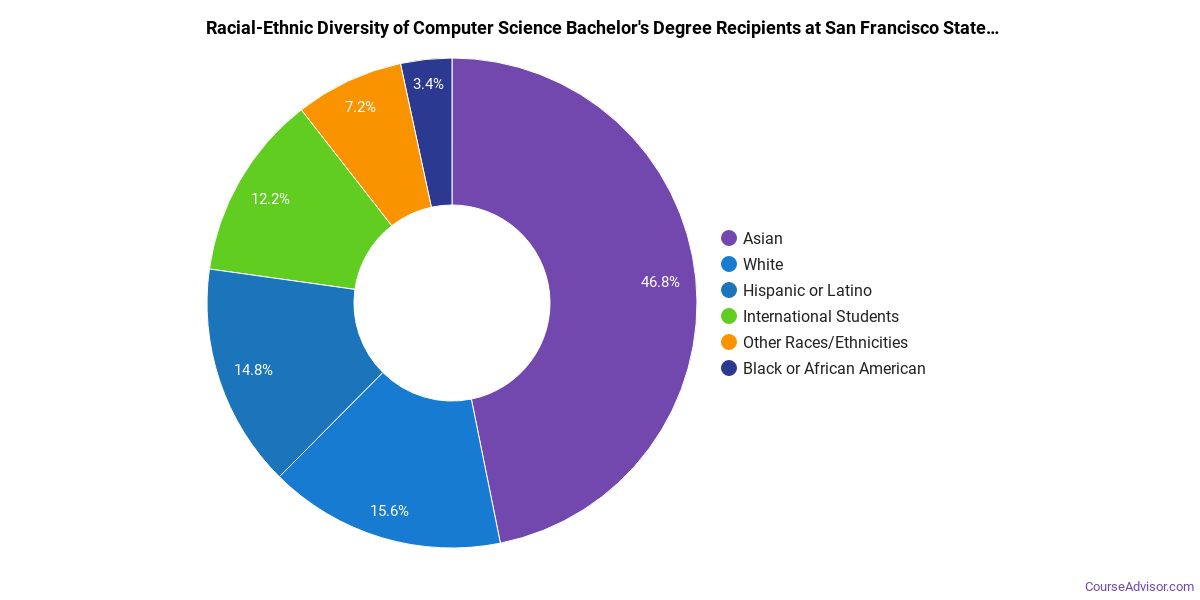
Racial-ethnic minorities make up 68% of Computer Science bachelor’s degree recipients at San Francisco State University, higher than the national average of 47%.*
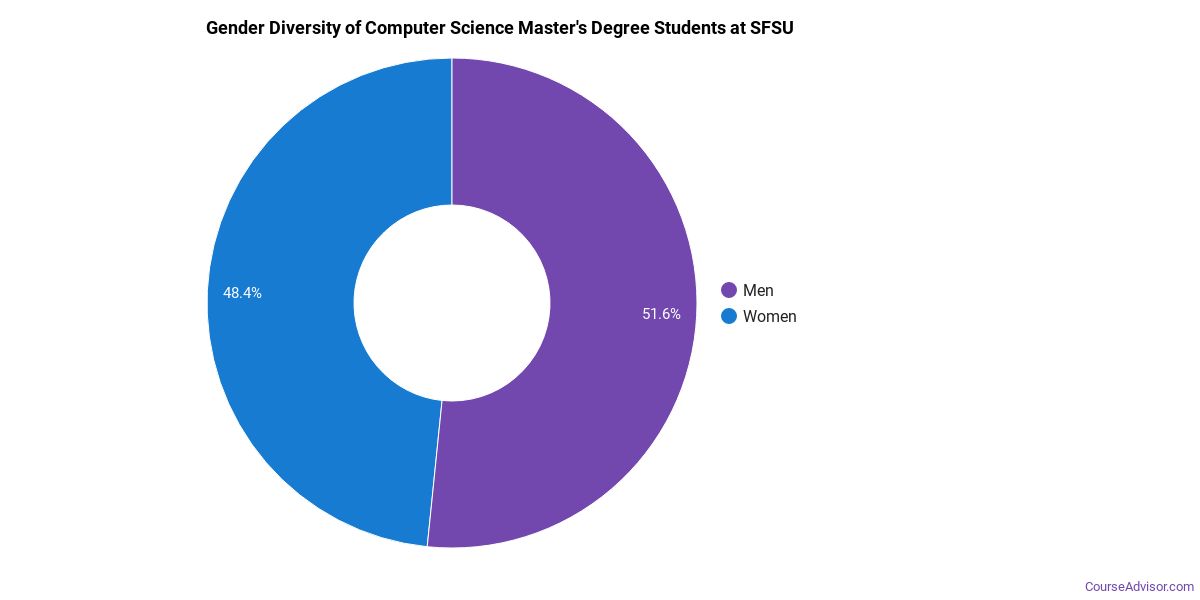
Computer Science Master’s Program at San Francisco State University
Among the 41 master’s computer science degrees awarded at San Francisco State University, 39% were women (16) and 61% were men (25).
The following table and chart show the race/ethnicity of Computer Science master’s degree recipients at San Francisco State University.
| Race / Ethnicity | Number of Graduates |
|---|---|
| White | 2 |
| Hispanic / Latino | 3 |
| Asian | 6 |
| International (Nonresident) | 27 |
| Unknown | 3 |
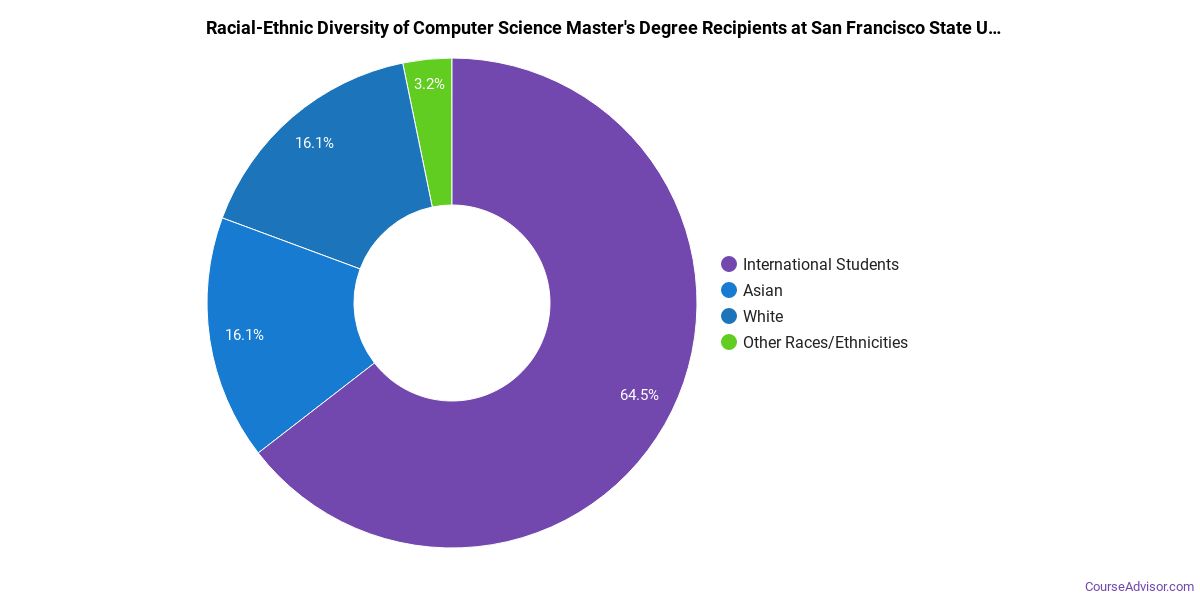
Minority students account for 22% of Computer Science master’s degree recipients at San Francisco State University, higher than the national average of 12%.*
*The racial-ethnic minorities figure is the total number of graduates minus White, international (nonresident), and unknown-race graduates.
More Specific Computer Science Concentrations at San Francisco State University
The Computer Science program at San Francisco State University offers more specialized concentrations:
| Concentration | Graduates |
|---|---|
| General Computer Science | 410 |
Top-Paying Careers for Computer Science Graduates
Students who finish Computer Science program at San Francisco State University work across a variety of fields. Here are the top-paying careers for Computer Science graduates, ordered by median annual salary:
| Occupation | Nationwide Median Wage |
|---|---|
| Computer and Information Systems Managers | $175,079 |
| Computer Occupations, All Other | $159,837 |
| Database Architects | $148,480 |
| Document Management Specialists | $147,490 |
| Business Intelligence Analysts | $143,840 |
| Information Security Engineers | $142,543 |
| Computer Systems Engineers/Architects | $140,795 |
| Web Developers | $125,527 |
| Information Technology Project Managers | $124,655 |
| Blockchain Engineers | $123,667 |
References
- IPEDS — Integrated Postsecondary Education Data System
- U.S. Department of Education — College Scorecard
- O*NET Online (Bureau of Labor Statistics)
- National Center for Education Statistics
More about our data sources and methodologies.
Course Advisor provides higher-education, college and university, degree, program, career, salary, and other helpful information to students, faculty, institutions, and other internet audiences. Presented information and data are subject to change. Inclusion on this website does not imply or represent a direct relationship with the company, school, or brand. Information, though believed correct at time of publication, may not be correct, and no warranty is provided. Contact the schools to verify any information before relying on it. Financial aid may be available for those who qualify. The displayed options may include sponsored or recommended results, not necessarily based on your preferences.
© Course Advisor – All Rights Reserved.