Music at Ohio State University-Main Campus
What traits are you looking for in a school for Music, take a look at what Ohio State University-Main Campus. Get started with the following essential facts.
Ohio State University-Main Campus is in Columbus, OH.
For the most recent IPEDS reporting year, 57 music graduations were recorded at Ohio State University-Main Campus.
Featured schools near , edit
Online & Distance Learning at Ohio State University-Main Campus
Distance learning is available at Ohio State University-Main Campus. Of 61,443 students, 3,975 (6%) were enrolled entirely in distance education and 34,956 (57%) took at least some classes online.
Music Rankings at Ohio State University-Main Campus
These rankings give you a sense of how Ohio State University-Main Campus’s Music program to other colleges that offer this major.
Bachelor’s-Level Rankings
| Ranking | Scope | Rank |
|---|---|---|
| Best Schools (Quality) | Ohio | #2 of 17 |
| Best Value | Ohio | #5 of 17 |
| Best Schools (Quality) | Great Lakes (Region) | #11 of 53 |
| Best Value | Great Lakes (Region) | #30 of 53 |
| Best Schools (Quality) | Nationwide | #97 of 423 |
| Best Value | Nationwide | #237 of 421 |
Master’s-Level Rankings
| Ranking | Scope | Rank |
|---|---|---|
| Best Schools (Quality) | Ohio | #2 of 17 |
| Best Value | Ohio | #5 of 17 |
| Best Schools (Quality) | Great Lakes (Region) | #11 of 53 |
| Best Value | Great Lakes (Region) | #30 of 53 |
| Best Schools (Quality) | Nationwide | #97 of 423 |
| Best Value | Nationwide | #237 of 421 |
Doctoral-Level Rankings
| Ranking | Scope | Rank |
|---|---|---|
| Best Schools (Quality) | Ohio | #2 of 17 |
| Best Value | Ohio | #5 of 17 |
| Best Schools (Quality) | Great Lakes (Region) | #11 of 53 |
| Best Value | Great Lakes (Region) | #30 of 53 |
| Best Schools (Quality) | Nationwide | #97 of 423 |
| Best Value | Nationwide | #237 of 421 |
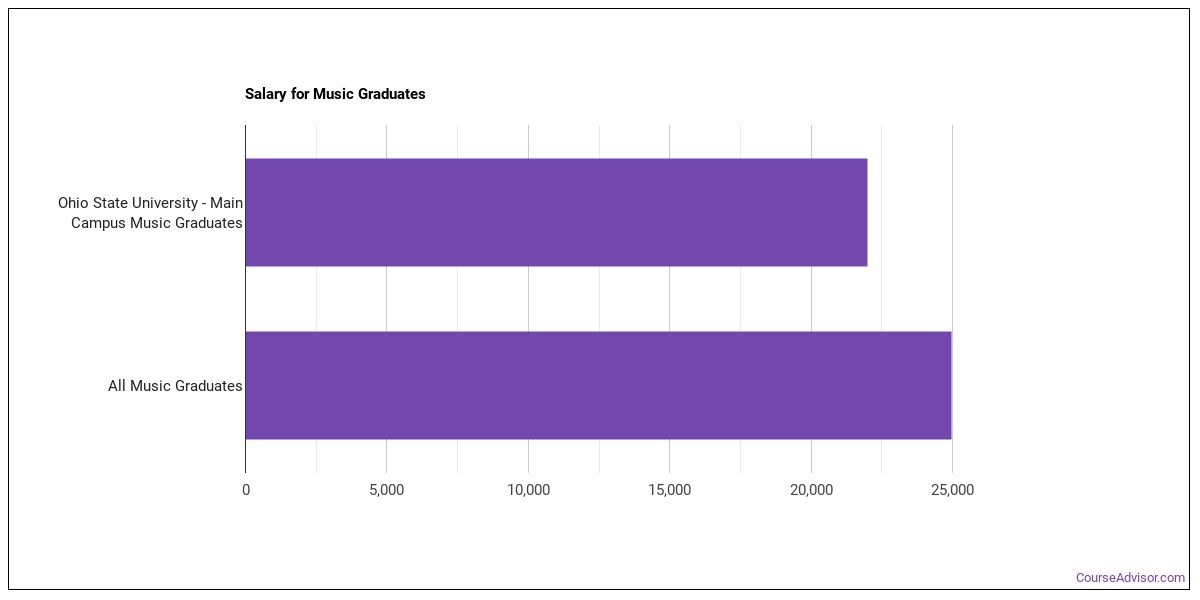
Earnings for Music Graduates from Ohio State University-Main Campus
Students who complete Ohio State University-Main Campus’s Music program report the following median earnings (per the U.S. Department of Education’s College Scorecard):
| Years After Graduation | Median Earnings |
|---|---|
| 1 year | $26,073 |
| 2 years | $32,084 |
| 3 years | $48,180 |
| 4 years | $40,034 |
| 5 years | $47,180 |
Is this above or below average for the school? Four years out, Music graduates from Ohio State University-Main Campus earn a median of $40,034, compared with $70,261 for all Ohio State University-Main Campus graduates — about 43% lower than the school-wide median.

Median Debt at Graduation
Median student loan debt for Music graduates from Ohio State University-Main Campus stands at $27,000.
Student Demographics & Diversity
Take a look at the diversity of Music graduates at Ohio State University-Main Campus, by degree type.
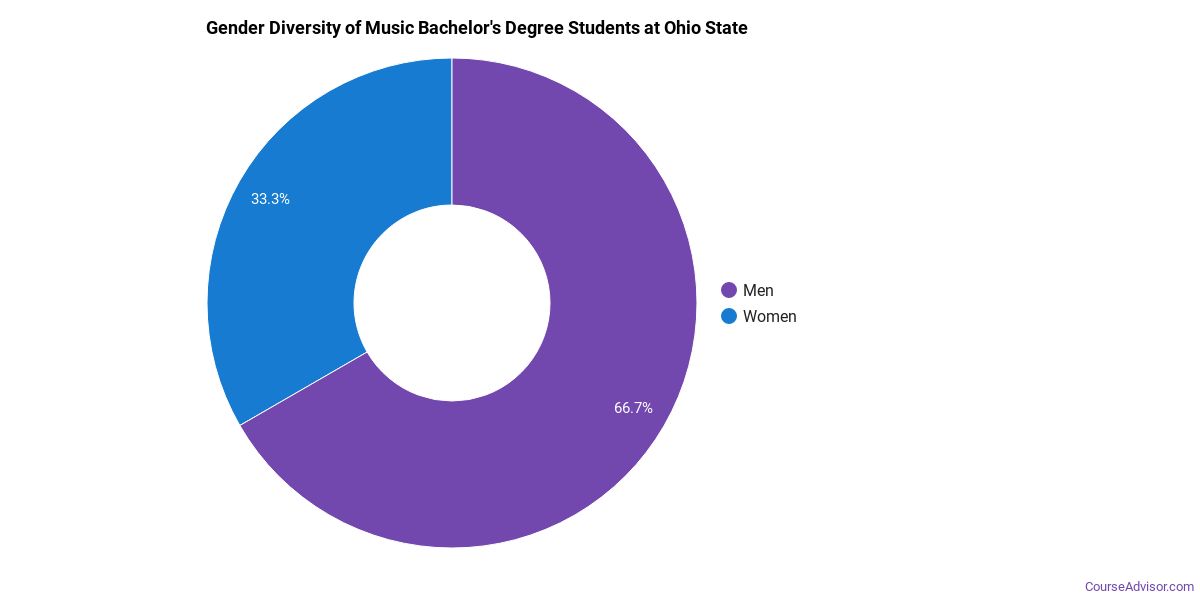
Program-wide, Music graduates at Ohio State University-Main Campus are 42% women (24) and 58% men (33).
Music Bachelor’s Program at Ohio State University-Main Campus
Of the 31 bachelor’s music degrees awarded at Ohio State University-Main Campus, 35% were women (11) and 65% were men (20).
The following table and chart show the race/ethnicity of Music bachelor’s degree recipients at Ohio State University-Main Campus.
| Race / Ethnicity | Number of Graduates |
|---|---|
| White | 20 |
| Hispanic / Latino | 1 |
| Black / African American | 3 |
| Asian | 2 |
| American Indian / Alaska Native | 1 |
| Two or More Races | 1 |
| International (Nonresident) | 3 |
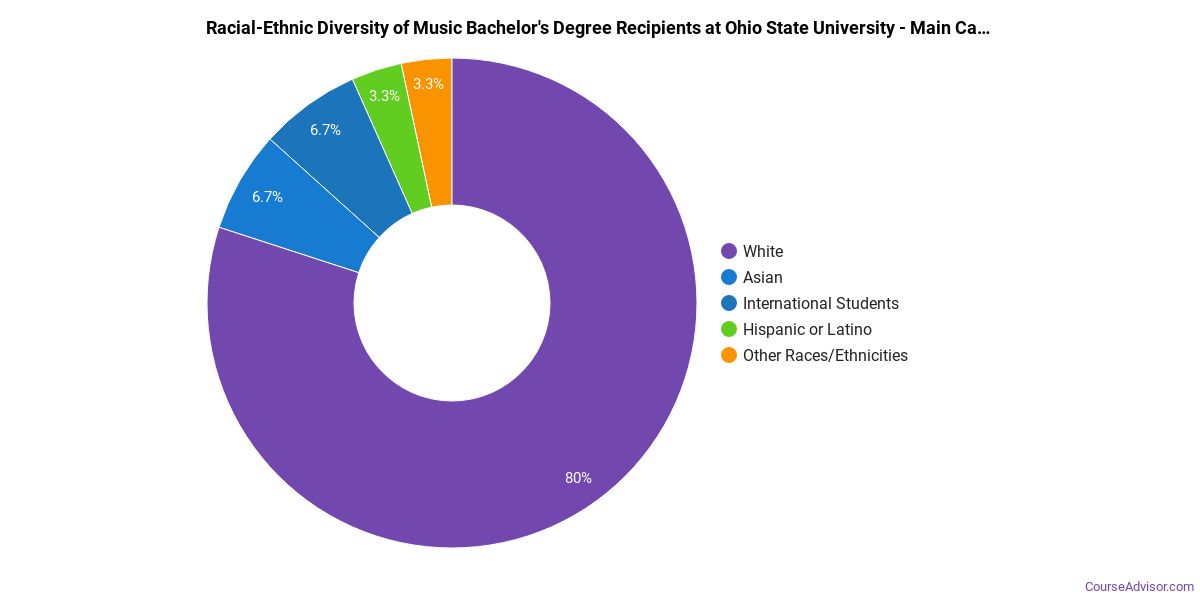
Racial-ethnic minorities make up 26% of Music bachelor’s degree recipients at Ohio State University-Main Campus, lower than the national average of 34%.*
Music Master’s Program at Ohio State University-Main Campus
Of the 15 master’s music degrees awarded at Ohio State University-Main Campus, 53% were women (8) and 47% were men (7).

The following table and chart show the race/ethnicity of Music master’s degree recipients at Ohio State University-Main Campus.
| Race / Ethnicity | Number of Graduates |
|---|---|
| White | 11 |
| Hispanic / Latino | 1 |
| Asian | 1 |
| International (Nonresident) | 2 |
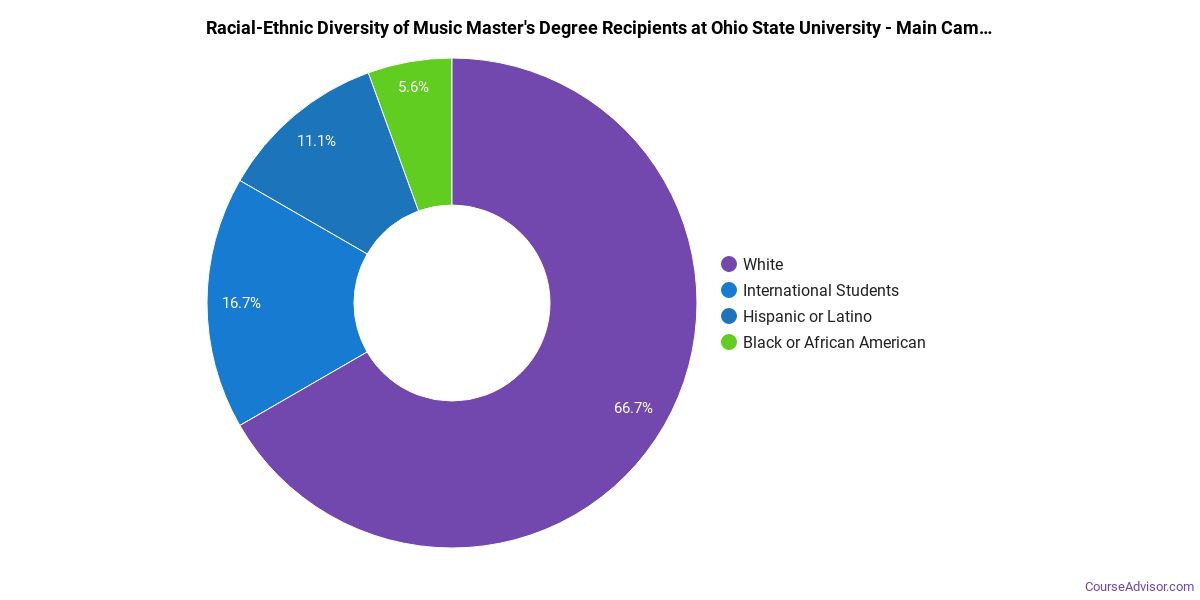
Racial-ethnic minorities make up 13% of Music master’s degree recipients at Ohio State University-Main Campus, lower than the national average of 23%.*
Music Doctoral Program at Ohio State University-Main Campus
Of the 11 doctoral music degrees awarded at Ohio State University-Main Campus, 45% were women (5) and 55% were men (6).

The following table and chart show the race/ethnicity of Music doctoral degree recipients at Ohio State University-Main Campus.
| Race / Ethnicity | Number of Graduates |
|---|---|
| White | 3 |
| Hispanic / Latino | 1 |
| Asian | 1 |
| International (Nonresident) | 6 |

Racial-ethnic minorities make up 18% of Music doctoral degree recipients at Ohio State University-Main Campus, above the national average of 17%.*
*The racial-ethnic minorities figure is the total number of graduates minus White, international (nonresident), and unknown-race graduates.
More Specific Music Concentrations at Ohio State University-Main Campus
This Music program at Ohio State University-Main Campus offers more specialized concentrations:
| Concentration | Graduates |
|---|---|
| General Music | 47 |
| Music Performance | 7 |
| Jazz Studies | 3 |
Best-Paid Careers for Music Graduates
Graduates of the Music program at Ohio State University-Main Campus go on to a range of careers. Here are the highest-paying careers for Music majors, ordered by median annual salary:
| Occupation | Nationwide Median Wage |
|---|---|
| Musicians and Singers | $96,571 |
| Disc Jockeys, Except Radio | $87,328 |
| Secondary School Teachers, Except Special and Career/Technical Education | $77,927 |
| Music Directors and Composers | $66,915 |
| Sound Engineering Technicians | $66,427 |
| Art, Drama, and Music Teachers, Postsecondary | $46,983 |
References
- IPEDS — Integrated Postsecondary Education Data System
- U.S. Department of Education — College Scorecard
- O*NET Online (Bureau of Labor Statistics)
- National Center for Education Statistics
More about our data sources and methodologies.
Course Advisor provides higher-education, college and university, degree, program, career, salary, and other helpful information to students, faculty, institutions, and other internet audiences. Presented information and data are subject to change. Inclusion on this website does not imply or represent a direct relationship with the company, school, or brand. Information, though believed correct at time of publication, may not be correct, and no warranty is provided. Contact the schools to verify any information before relying on it. Financial aid may be available for those who qualify. The displayed options may include sponsored or recommended results, not necessarily based on your preferences.
© Course Advisor – All Rights Reserved.