General Music at Ohio State University-Main Campus
What traits are you looking for in a school for General Music, you may want to check out the program at Ohio State University-Main Campus. We’ve gathered the following information to help you decide.
Ohio State University-Main Campus is located in Columbus, OH.
During the most recent reporting year, 47 general music graduations were recorded at Ohio State University-Main Campus.
Featured schools near , edit
Online & Distance Learning at Ohio State University-Main Campus
Online coursework is an option at Ohio State University-Main Campus. Among 61,443 students, 3,975 (6%) studied exclusively online and 34,956 (57%) took at least some classes online.
Student Demographics & Diversity
The following sections describe the diversity of General Music graduates at Ohio State University-Main Campus, broken down by degree level.
Looking at the program as a whole, General Music graduates at Ohio State University-Main Campus are 43% women (20) and 57% men (27).
General Music Bachelor’s Program at Ohio State University-Main Campus
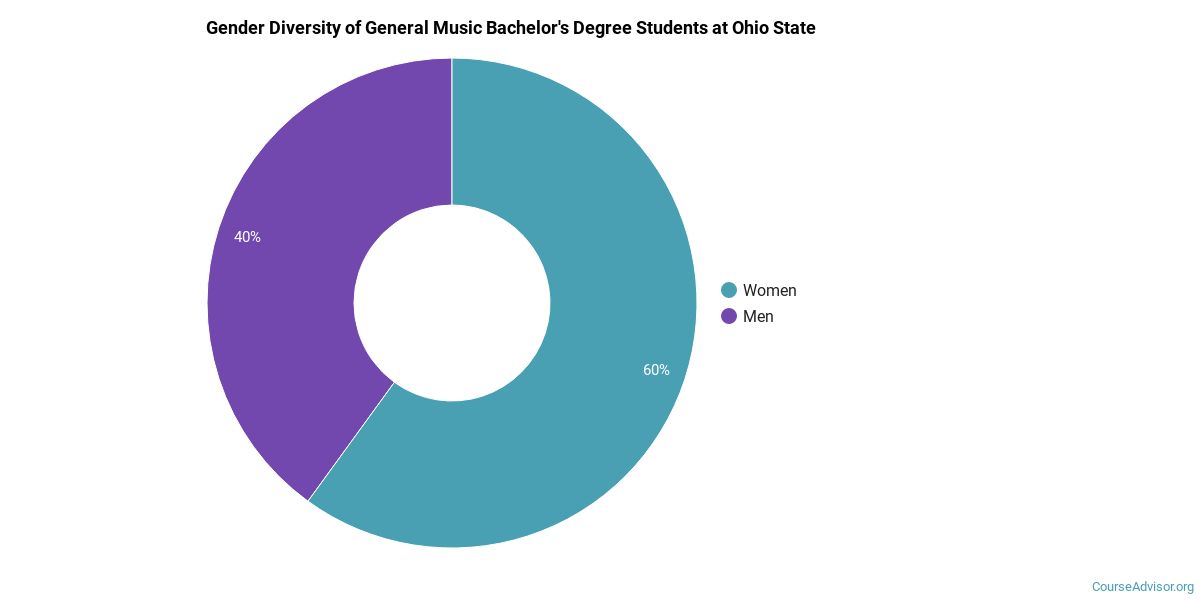
Among the 21 bachelor’s general music degrees awarded at Ohio State University-Main Campus, 33% were women (7) and 67% were men (14).
The following table and chart show the race/ethnicity of General Music bachelor’s degree recipients at Ohio State University-Main Campus.
| Race / Ethnicity | Number of Graduates |
|---|---|
| White | 14 |
| Hispanic / Latino | 1 |
| Black / African American | 1 |
| Asian | 1 |
| American Indian / Alaska Native | 1 |
| Two or More Races | 1 |
| International (Nonresident) | 2 |

Minority students account for 24% of General Music bachelor’s degree recipients at Ohio State University-Main Campus, below the national average of 37%.*
General Music Master’s Program at Ohio State University-Main Campus
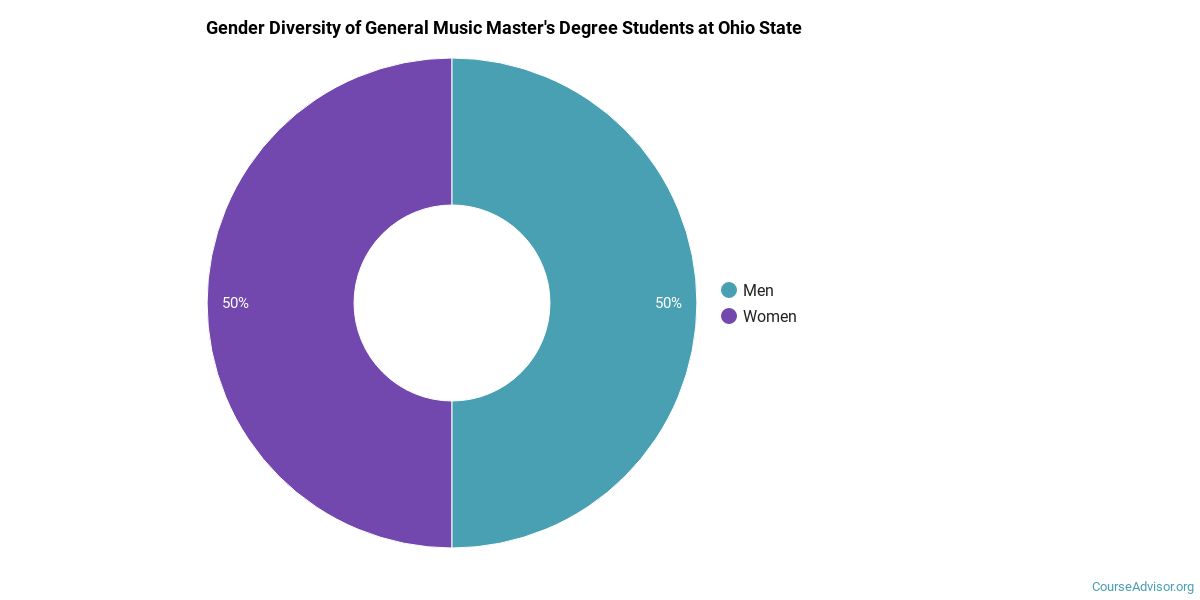
Of the 15 master’s general music degrees awarded at Ohio State University-Main Campus, 53% were women (8) and 47% were men (7).
The following table and chart show the race/ethnicity of General Music master’s degree recipients at Ohio State University-Main Campus.
| Race / Ethnicity | Number of Graduates |
|---|---|
| White | 11 |
| Hispanic / Latino | 1 |
| Asian | 1 |
| International (Nonresident) | 2 |

Racial-ethnic minorities make up 13% of General Music master’s degree recipients at Ohio State University-Main Campus, below the national average of 24%.*
General Music Doctoral Program at Ohio State University-Main Campus
Among the 11 doctoral general music graduates at Ohio State University-Main Campus, 45% were women (5) and 55% were men (6).

The following table and chart show the race/ethnicity of General Music doctoral degree recipients at Ohio State University-Main Campus.
| Race / Ethnicity | Number of Graduates |
|---|---|
| White | 3 |
| Hispanic / Latino | 1 |
| Asian | 1 |
| International (Nonresident) | 6 |

Racial-ethnic minorities make up 18% of General Music doctoral degree recipients at Ohio State University-Main Campus, above the national average of 13%.*
*The racial-ethnic minorities figure is the total number of graduates minus White, international (nonresident), and unknown-race graduates.
Best-Paid Careers for General Music Graduates
Graduates of the General Music program at Ohio State University-Main Campus work across a variety of fields. Here are the best-paid careers for General Music majors, ordered by median annual salary:
| Occupation | Nationwide Median Wage |
|---|---|
| Musicians and Singers | $96,571 |
| Secondary School Teachers, Except Special and Career/Technical Education | $77,927 |
References
- IPEDS — Integrated Postsecondary Education Data System
- U.S. Department of Education — College Scorecard
- O*NET Online (Bureau of Labor Statistics)
- National Center for Education Statistics
More about our data sources and methodologies.
Course Advisor provides higher-education, college and university, degree, program, career, salary, and other helpful information to students, faculty, institutions, and other internet audiences. Presented information and data are subject to change. Inclusion on this website does not imply or represent a direct relationship with the company, school, or brand. Information, though believed correct at time of publication, may not be correct, and no warranty is provided. Contact the schools to verify any information before relying on it. Financial aid may be available for those who qualify. The displayed options may include sponsored or recommended results, not necessarily based on your preferences.
© Course Advisor – All Rights Reserved.