General Architecture at Norwich University
If you are interested in studying General Architecture, take a look at what Norwich University. The following information will help you decide if it is a good fit for you.
Norwich University is in Northfield, VT.
In the most recent year for which we have data, 24 general architecture degrees were granted at Norwich University.
Featured schools near , edit
Studying Online at Norwich University
Many students take online classes at Norwich University. Of 3,149 students, 995 (32%) studied exclusively online and 410 (13%) took at least some classes online.
General Architecture Rankings at Norwich University
Use these rankings to compare Norwich University’s General Architecture program to other colleges that offer this major.
Bachelor’s-Level Rankings
| Ranking | Scope | Rank |
|---|---|---|
| Best Value | Vermont | #1 of 2 |
| Best Schools (Quality) | Vermont | #2 of 2 |
| Best Value | New England (Region) | #3 of 6 |
| Best Schools (Quality) | New England (Region) | #6 of 6 |
| Best Value | Nationwide | #66 of 81 |
| Best Schools (Quality) | Nationwide | #69 of 81 |
Master’s-Level Rankings
| Ranking | Scope | Rank |
|---|---|---|
| Best Value | Vermont | #1 of 2 |
| Best Schools (Quality) | Vermont | #2 of 2 |
| Best Value | New England (Region) | #3 of 6 |
| Best Schools (Quality) | New England (Region) | #6 of 6 |
| Best Value | Nationwide | #66 of 81 |
| Best Schools (Quality) | Nationwide | #69 of 81 |
Earnings for General Architecture Graduates from Norwich University
Graduates of Norwich University’s General Architecture program report the following median earnings (per the U.S. Department of Education’s College Scorecard):

| Years After Graduation | Median Earnings |
|---|---|
| 1 year | $46,388 |
| 2 years | $44,989 |
| 3 years | $49,082 |
| 4 years | $53,962 |
| 5 years | $61,766 |
How do these earnings stack up against the rest of the school? Four years after graduating, General Architecture graduates from Norwich University earn a median of $53,962, compared with $75,763 for all Norwich University graduates — about 29% lower than the school-wide median.

Median Debt at Graduation
Median student loan debt for General Architecture graduates from Norwich University comes in at $27,000.
Student Demographics & Diversity
Take a look at the composition of General Architecture graduates at Norwich University, broken down by degree level.
Across all degree levels, General Architecture graduates at Norwich University are 58% women (14) and 42% men (10).
General Architecture Bachelor’s Program at Norwich University
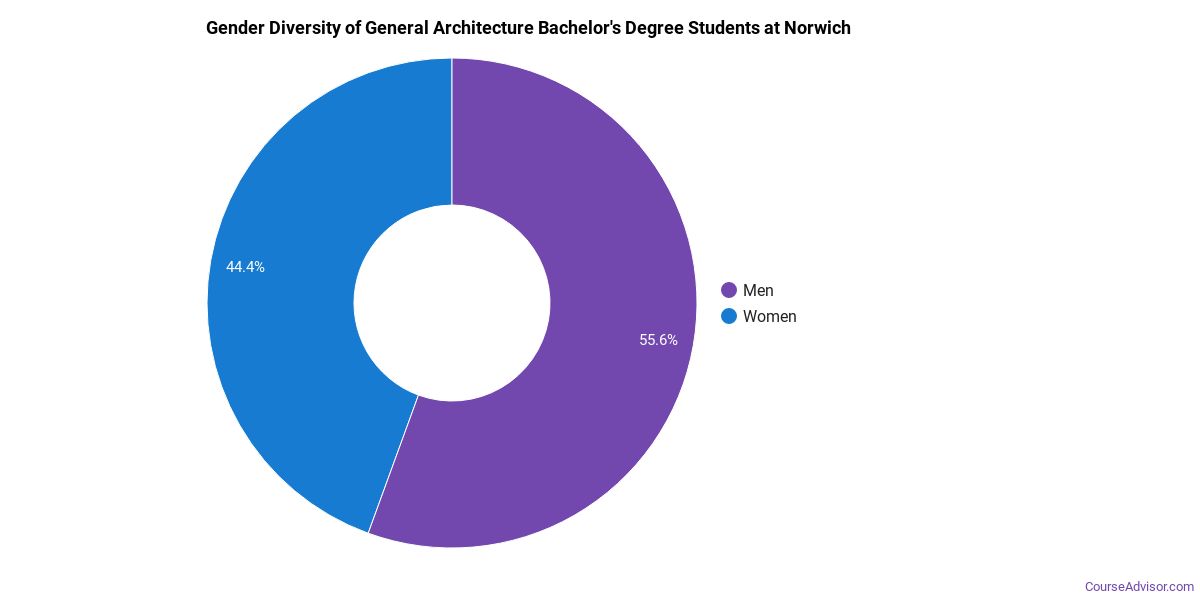
Of the 18 bachelor’s general architecture degrees awarded at Norwich University, 56% were women (10) and 44% were men (8).
The following table and chart show the race/ethnicity of General Architecture bachelor’s degree recipients at Norwich University.
| Race / Ethnicity | Number of Graduates |
|---|---|
| White | 14 |
| Hispanic / Latino | 1 |
| International (Nonresident) | 2 |
| Unknown | 1 |
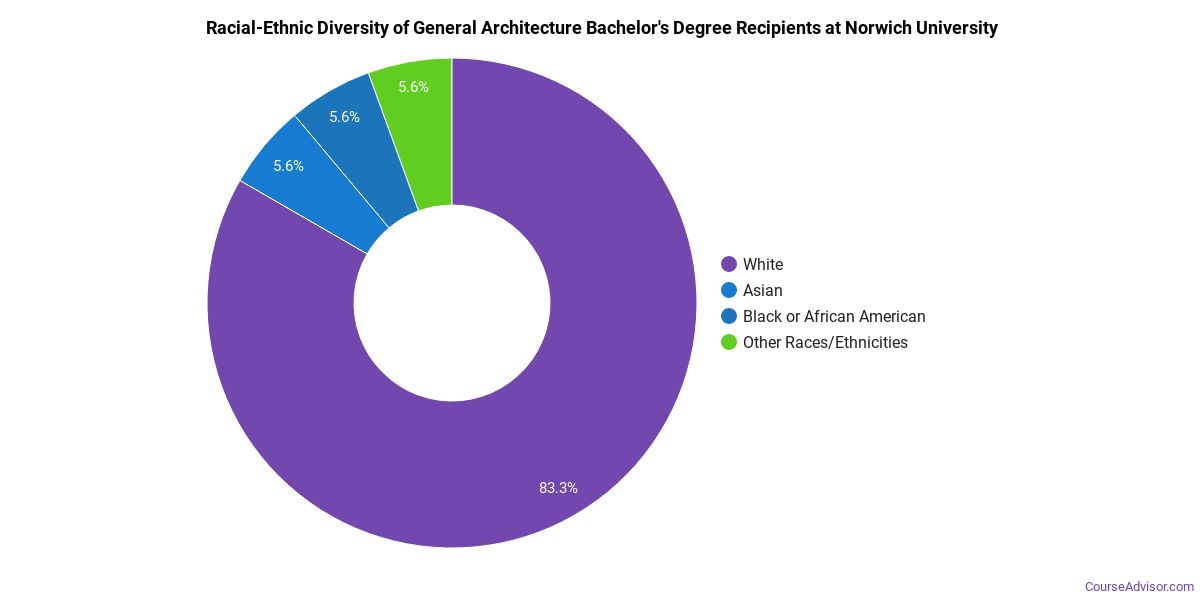
Racial-ethnic minorities make up 6% of General Architecture bachelor’s degree recipients at Norwich University, lower than the national average of 46%.*
General Architecture Master’s Program at Norwich University
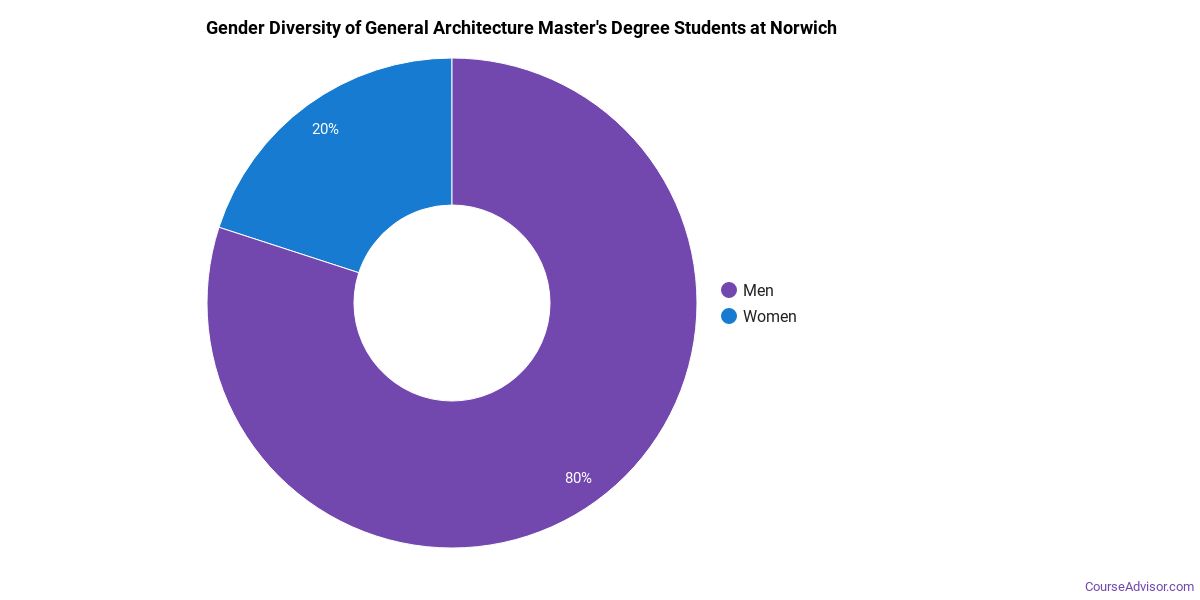
Among the 6 master’s general architecture degrees awarded at Norwich University, 67% were women (4) and 33% were men (2).
The following table and chart show the race/ethnicity of General Architecture master’s degree recipients at Norwich University.
| Race / Ethnicity | Number of Graduates |
|---|---|
| White | 5 |
| Hispanic / Latino | 1 |
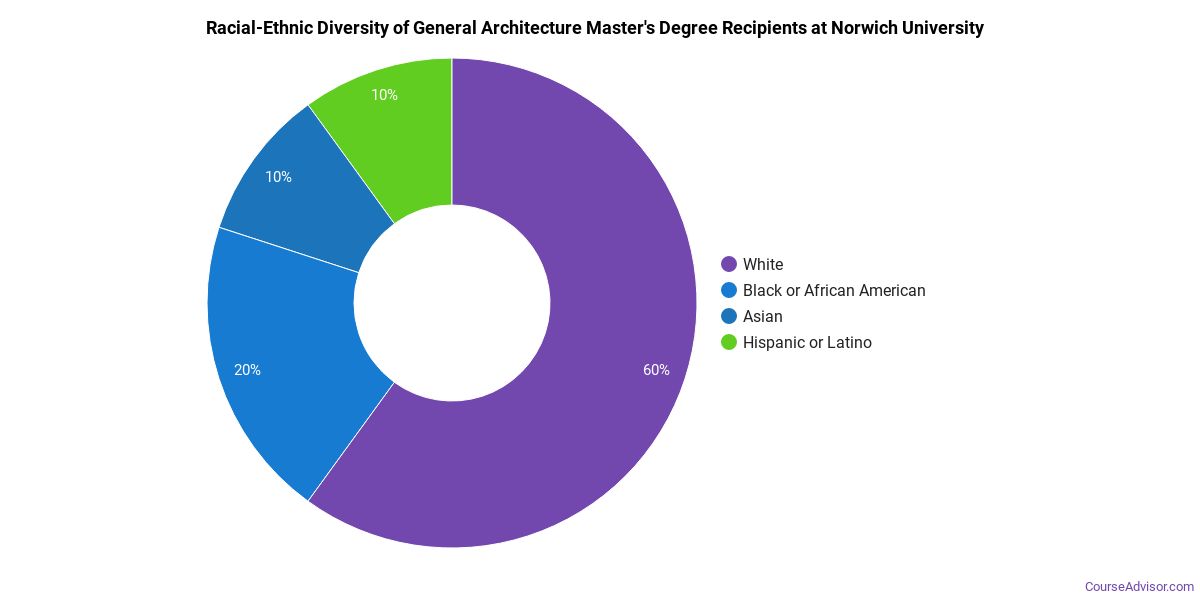
Racial-ethnic minorities make up 17% of General Architecture master’s degree recipients at Norwich University, below the national average of 37%.*
*The racial-ethnic minorities figure is the total number of graduates minus White, international (nonresident), and unknown-race graduates.
More Specific General Architecture Concentrations at Norwich University
This General Architecture program at Norwich University breaks down into more specific concentrations:
| Concentration | Graduates |
|---|---|
| Architecture | 24 |
Top-Paying Careers for General Architecture Graduates
Graduates of the General Architecture program at Norwich University pursue many career paths. The table below ranks the top-paying careers for General Architecture graduates, ordered by median annual salary:
| Occupation | Nationwide Median Wage |
|---|---|
| Architects, Except Landscape and Naval | $116,710 |
| Architectural and Engineering Managers | $101,277 |
| Biofuels/Biodiesel Technology and Product Development Managers | $89,263 |
| Architecture Teachers, Postsecondary | $66,757 |
References
- IPEDS — Integrated Postsecondary Education Data System
- U.S. Department of Education — College Scorecard
- O*NET Online (Bureau of Labor Statistics)
- National Center for Education Statistics
More about our data sources and methodologies.
Course Advisor provides higher-education, college and university, degree, program, career, salary, and other helpful information to students, faculty, institutions, and other internet audiences. Presented information and data are subject to change. Inclusion on this website does not imply or represent a direct relationship with the company, school, or brand. Information, though believed correct at time of publication, may not be correct, and no warranty is provided. Contact the schools to verify any information before relying on it. Financial aid may be available for those who qualify. The displayed options may include sponsored or recommended results, not necessarily based on your preferences.
© Course Advisor – All Rights Reserved.