Political Science & Government at Massachusetts Institute of Technology
What traits are you looking for in a school for Political Science & Government, you may want to check out the program at Massachusetts Institute of Technology. Get started with the following essential facts.
Massachusetts Institute of Technology is located in Cambridge, MA.
In the most recent year for which we have data, 28 political science & government graduations were recorded at Massachusetts Institute of Technology.
Featured schools near , edit
Studying Online at Massachusetts Institute of Technology
Many students take online classes at Massachusetts Institute of Technology. Of 11,886 students, 46 (0%) were enrolled entirely in distance education and 0 (0%) took at least some classes online.
Student Demographics & Diversity
Below you’ll find the student demographics for Political Science & Government graduates at Massachusetts Institute of Technology, by degree type.
Program-wide, Political Science & Government graduates at Massachusetts Institute of Technology are 43% women (12) and 57% men (16).
Political Science & Government Bachelor’s Program at Massachusetts Institute of Technology
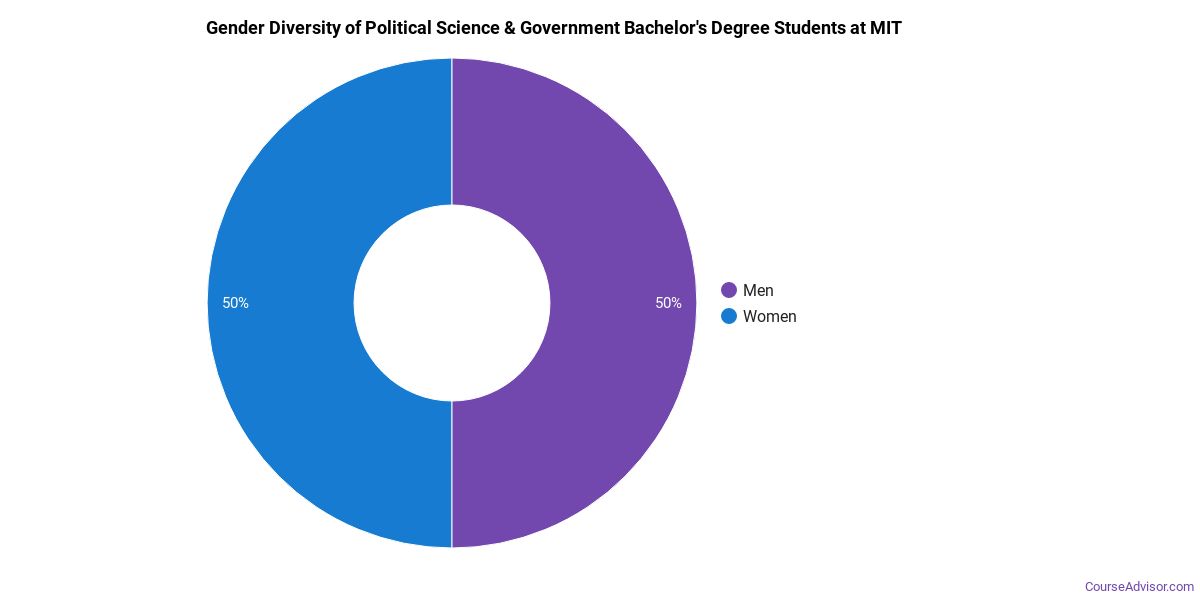
Among the 7 bachelor’s political science & government graduates at Massachusetts Institute of Technology, 57% were women (4) and 43% were men (3).
The following table and chart show the race/ethnicity of Political Science & Government bachelor’s degree recipients at Massachusetts Institute of Technology.
| Race / Ethnicity | Number of Graduates |
|---|---|
| White | 3 |
| Hispanic / Latino | 1 |
| Asian | 1 |
| International (Nonresident) | 1 |
| Unknown | 1 |
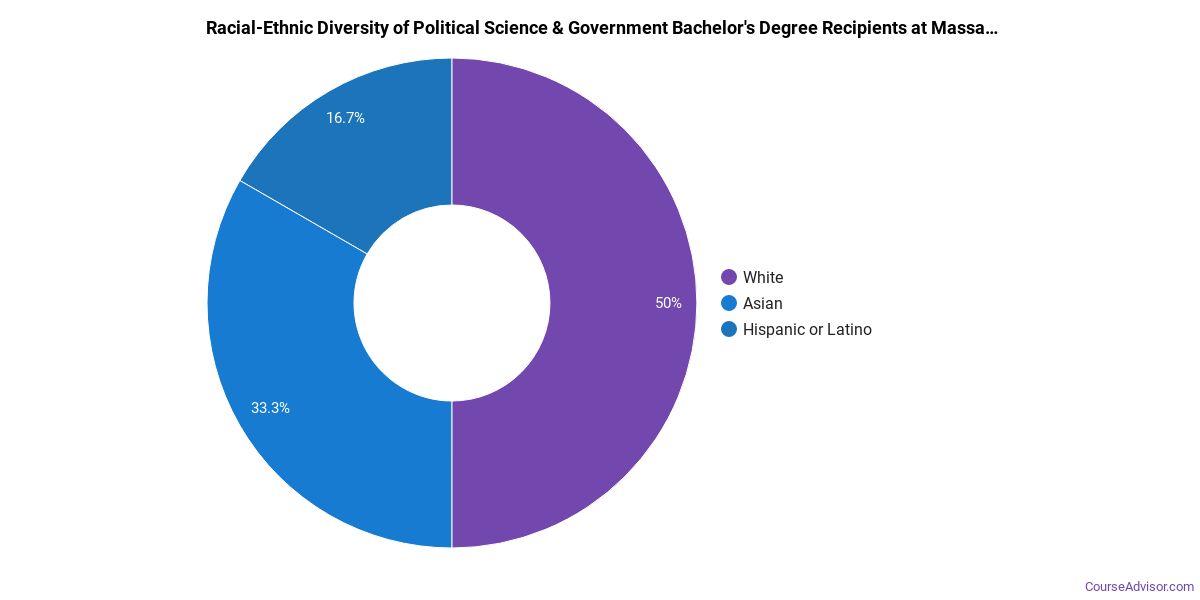
Racial-ethnic minorities make up 29% of Political Science & Government bachelor’s degree recipients at Massachusetts Institute of Technology, lower than the national average of 41%.*
Political Science & Government Master’s Program at Massachusetts Institute of Technology
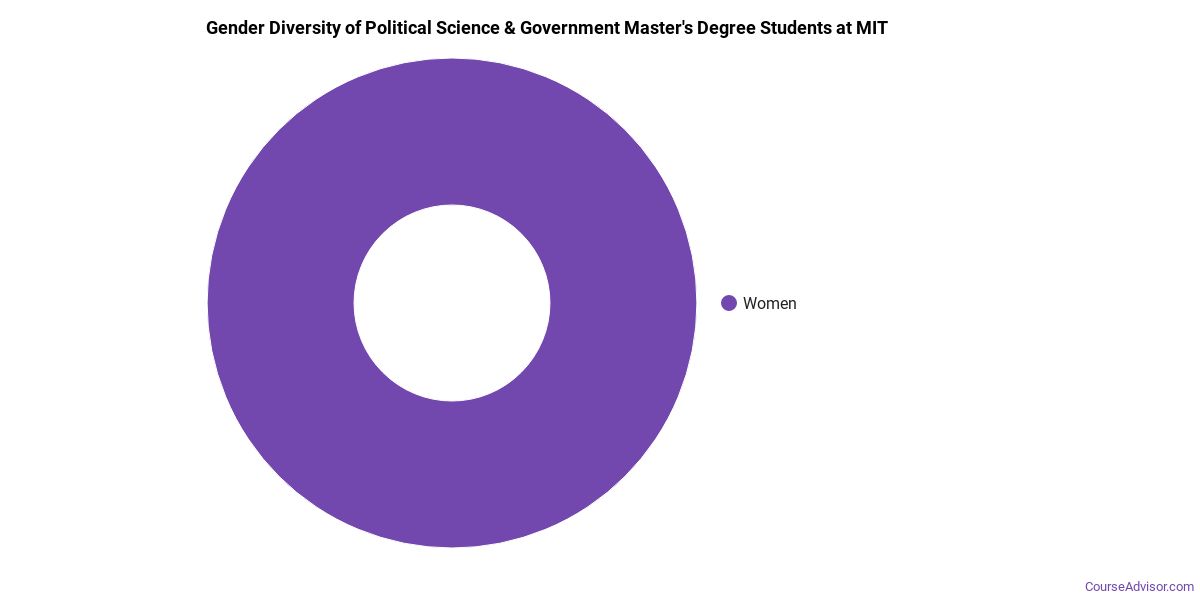
Among the 4 master’s political science & government graduates at Massachusetts Institute of Technology, 25% were women (1) and 75% were men (3).
The following table and chart show the race/ethnicity of Political Science & Government master’s degree recipients at Massachusetts Institute of Technology.
| Race / Ethnicity | Number of Graduates |
|---|---|
| White | 1 |
| Asian | 1 |
| Two or More Races | 1 |
| International (Nonresident) | 1 |
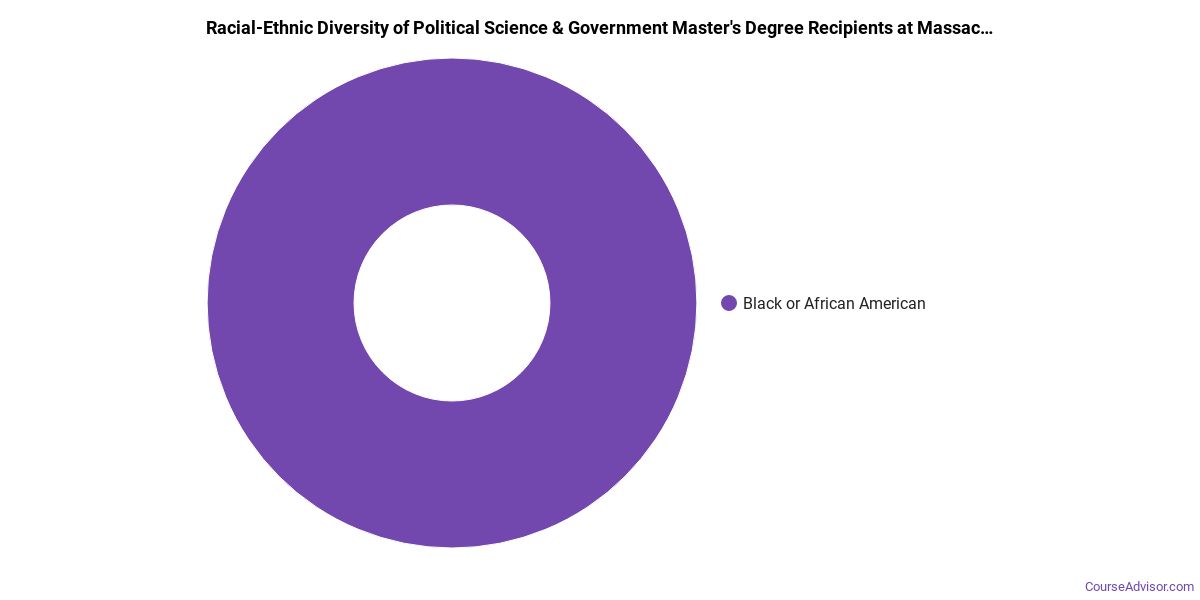
Racial-ethnic minorities make up 50% of Political Science & Government master’s degree recipients at Massachusetts Institute of Technology, above the national average of 29%.*
Political Science & Government Doctoral Program at Massachusetts Institute of Technology
Among the 17 doctoral political science & government graduates at Massachusetts Institute of Technology, 41% were women (7) and 59% were men (10).

The following table and chart show the race/ethnicity of Political Science & Government doctoral degree recipients at Massachusetts Institute of Technology.
| Race / Ethnicity | Number of Graduates |
|---|---|
| White | 7 |
| Two or More Races | 1 |
| International (Nonresident) | 6 |
| Unknown | 3 |

Minority students account for 6% of Political Science & Government doctoral degree recipients at Massachusetts Institute of Technology, below the national average of 16%.*
*The racial-ethnic minorities figure is the total number of graduates minus White, international (nonresident), and unknown-race graduates.
More Specific Political Science & Government Concentrations at Massachusetts Institute of Technology
The Political Science & Government program at Massachusetts Institute of Technology breaks down into more specific concentrations:
| Concentration | Graduates |
|---|---|
| Political Science | 28 |
Highest-Paying Careers for Political Science & Government Graduates
Graduates of the Political Science & Government program at Massachusetts Institute of Technology pursue many career paths. Below are the best-paid careers for Political Science & Government majors, ordered by median annual salary:
| Occupation | Nationwide Median Wage |
|---|---|
| Wind Energy Development Managers | $169,952 |
| Loss Prevention Managers | $165,723 |
| Wind Energy Operations Managers | $122,567 |
| Compliance Managers | $117,178 |
| Brownfield Redevelopment Specialists and Site Managers | $99,321 |
| Managers, All Other | $95,684 |
| Environmental Economists | $86,726 |
| Secondary School Teachers, Except Special and Career/Technical Education | $77,927 |
| Regulatory Affairs Managers | $77,828 |
| Economists | $73,611 |
References
- IPEDS — Integrated Postsecondary Education Data System
- U.S. Department of Education — College Scorecard
- O*NET Online (Bureau of Labor Statistics)
- National Center for Education Statistics
More about our data sources and methodologies.
Course Advisor provides higher-education, college and university, degree, program, career, salary, and other helpful information to students, faculty, institutions, and other internet audiences. Presented information and data are subject to change. Inclusion on this website does not imply or represent a direct relationship with the company, school, or brand. Information, though believed correct at time of publication, may not be correct, and no warranty is provided. Contact the schools to verify any information before relying on it. Financial aid may be available for those who qualify. The displayed options may include sponsored or recommended results, not necessarily based on your preferences.
© Course Advisor – All Rights Reserved.