General Computer Science at Massachusetts Institute of Technology
If you are interested in studying General Computer Science, you may want to check out the program at Massachusetts Institute of Technology. The following information will help you decide if it is a good fit for you.
Massachusetts Institute of Technology is in Cambridge, MA.
In the most recent year for which we have data, 688 general computer science degrees were granted at Massachusetts Institute of Technology.
Featured schools near , edit
Online Class Availability at Massachusetts Institute of Technology
Online coursework is an option at Massachusetts Institute of Technology. Among 11,886 students, 46 (0%) were enrolled entirely in distance education and 0 (0%) took at least some classes online.
Student Demographics & Diversity
Take a look at the student demographics for General Computer Science graduates at Massachusetts Institute of Technology, broken down by degree level.
Program-wide, General Computer Science graduates at Massachusetts Institute of Technology are 36% women (251) and 64% men (437).
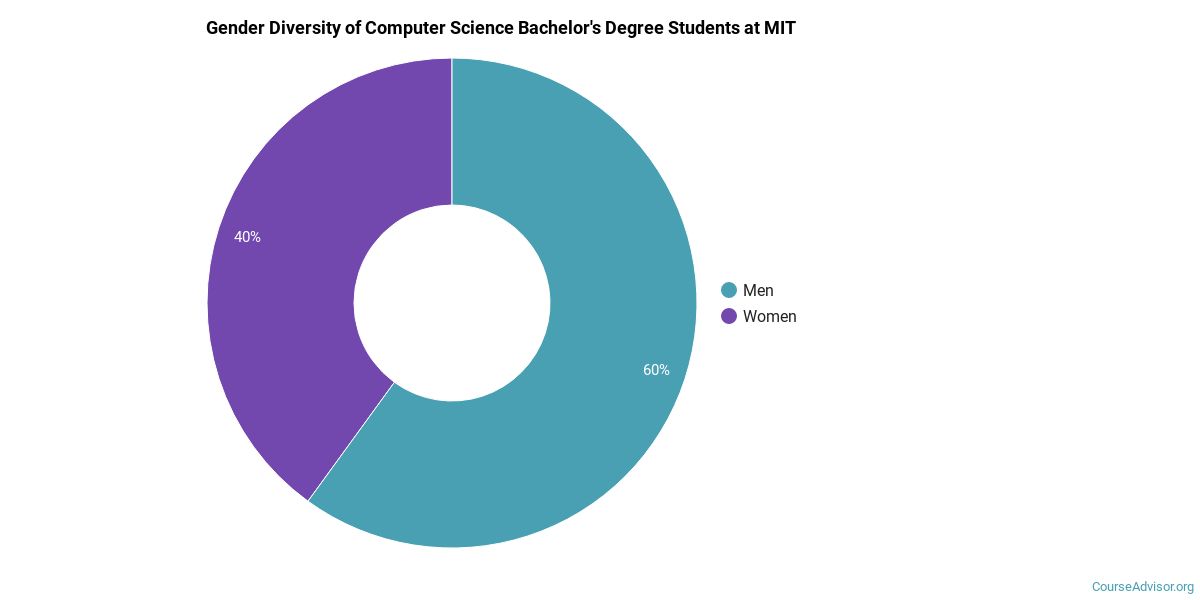
General Computer Science Bachelor’s Program at Massachusetts Institute of Technology
Among the 366 bachelor’s general computer science degrees awarded at Massachusetts Institute of Technology, 40% were women (145) and 60% were men (221).
The following table and chart show the race/ethnicity of General Computer Science bachelor’s degree recipients at Massachusetts Institute of Technology.
| Race / Ethnicity | Number of Graduates |
|---|---|
| White | 50 |
| Hispanic / Latino | 38 |
| Black / African American | 15 |
| Asian | 176 |
| Native Hawaiian / Pacific Islander | 1 |
| Two or More Races | 25 |
| International (Nonresident) | 51 |
| Unknown | 10 |

Racial-ethnic minorities make up 70% of General Computer Science bachelor’s degree recipients at Massachusetts Institute of Technology, above the national average of 47%.*
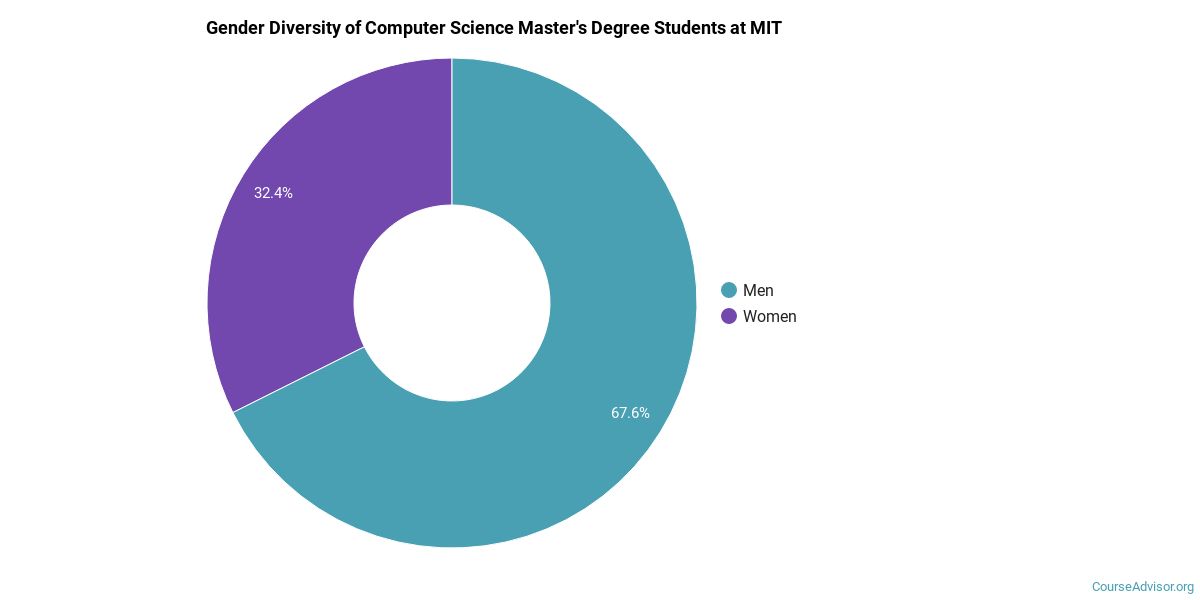
General Computer Science Master’s Program at Massachusetts Institute of Technology
Of the 236 master’s general computer science degrees awarded at Massachusetts Institute of Technology, 37% were women (87) and 63% were men (149).
The following table and chart show the race/ethnicity of General Computer Science master’s degree recipients at Massachusetts Institute of Technology.
| Race / Ethnicity | Number of Graduates |
|---|---|
| White | 40 |
| Hispanic / Latino | 16 |
| Black / African American | 4 |
| Asian | 84 |
| Two or More Races | 14 |
| International (Nonresident) | 66 |
| Unknown | 12 |

Minority students account for 50% of General Computer Science master’s degree recipients at Massachusetts Institute of Technology, above the national average of 12%.*
General Computer Science Doctoral Program at Massachusetts Institute of Technology
Of the 86 doctoral general computer science graduates at Massachusetts Institute of Technology, 22% were women (19) and 78% were men (67).

The following table and chart show the race/ethnicity of General Computer Science doctoral degree recipients at Massachusetts Institute of Technology.
| Race / Ethnicity | Number of Graduates |
|---|---|
| White | 13 |
| Hispanic / Latino | 4 |
| Black / African American | 1 |
| Asian | 12 |
| Two or More Races | 2 |
| International (Nonresident) | 49 |
| Unknown | 5 |

Minority students account for 22% of General Computer Science doctoral degree recipients at Massachusetts Institute of Technology, above the national average of 13%.*
*The racial-ethnic minorities figure is the total number of graduates minus White, international (nonresident), and unknown-race graduates.
Top-Paying Careers for General Computer Science Graduates
Those who complete General Computer Science program at Massachusetts Institute of Technology work across a variety of fields. Below are the highest-paying careers for General Computer Science majors, ordered by median annual salary:
| Occupation | Nationwide Median Wage |
|---|---|
| Computer and Information Systems Managers | $175,079 |
| Computer Occupations, All Other | $159,837 |
| Database Architects | $148,480 |
| Document Management Specialists | $147,490 |
| Business Intelligence Analysts | $143,840 |
| Information Security Engineers | $142,543 |
| Computer Systems Engineers/Architects | $140,795 |
| Web Developers | $125,527 |
| Information Technology Project Managers | $124,655 |
| Blockchain Engineers | $123,667 |
References
- IPEDS — Integrated Postsecondary Education Data System
- U.S. Department of Education — College Scorecard
- O*NET Online (Bureau of Labor Statistics)
- National Center for Education Statistics
More about our data sources and methodologies.
Course Advisor provides higher-education, college and university, degree, program, career, salary, and other helpful information to students, faculty, institutions, and other internet audiences. Presented information and data are subject to change. Inclusion on this website does not imply or represent a direct relationship with the company, school, or brand. Information, though believed correct at time of publication, may not be correct, and no warranty is provided. Contact the schools to verify any information before relying on it. Financial aid may be available for those who qualify. The displayed options may include sponsored or recommended results, not necessarily based on your preferences.
© Course Advisor – All Rights Reserved.