Communication & Media Studies at Marymount University
If you are interested in studying Communication & Media Studies, consider the program at Marymount University. The following information will help you decide if it is a good fit for you.
Marymount University sits in Arlington, VA.
In the most recent year for which we have data, 11 communication & media studies graduations were recorded at Marymount University.
Featured schools near , edit
Online & Distance Learning at Marymount University
Online coursework is an option at Marymount University. Among 4,060 students, 832 (20%) were enrolled entirely in distance education and 1,184 (29%) took at least some classes online.
Communication & Media Studies Rankings at Marymount University
These rankings give you a sense of how Marymount University’s Communication & Media Studies program to other colleges that offer this major.
Bachelor’s-Level Rankings
| Ranking | Scope | Rank |
|---|---|---|
| Best Schools (Quality) | Virginia | #10 of 21 |
| Best Value | Virginia | #18 of 21 |
| Best Schools (Quality) | Southeast (Region) | #45 of 162 |
| Best Value | Southeast (Region) | #140 of 162 |
| Best Schools (Quality) | Nationwide | #243 of 776 |
| Best Value | Nationwide | #609 of 772 |
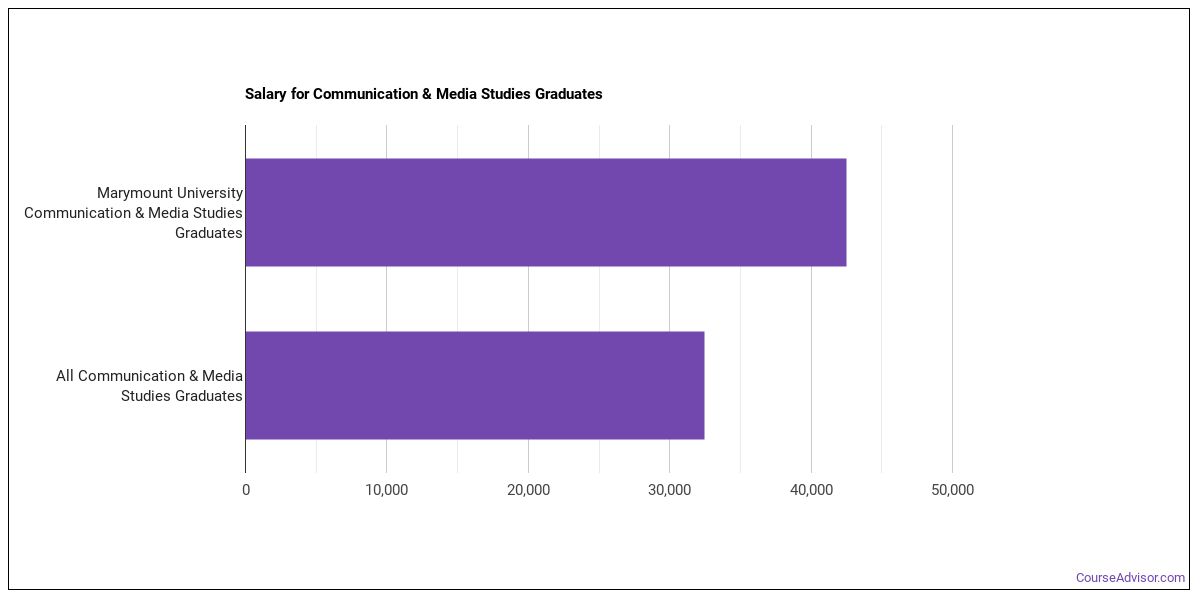
Earnings for Communication & Media Studies Graduates from Marymount University
Those who finish Marymount University’s Communication & Media Studies program earn the following amounts (per the U.S. Department of Education’s College Scorecard):
| Years After Graduation | Median Earnings |
|---|---|
| 1 year | $42,506 |
| 2 years | $39,369 |
| 3 years | $42,154 |
| 4 years | $57,346 |
| 5 years | $69,844 |
How do these earnings stack up against the rest of the school? At the four-year mark, Communication & Media Studies graduates from Marymount University report median earnings of $57,346, compared with $74,353 for all Marymount University graduates — about 23% lower than the school-wide median.

Student Demographics & Diversity
Take a look at the composition of Communication & Media Studies graduates at Marymount University, by degree type.
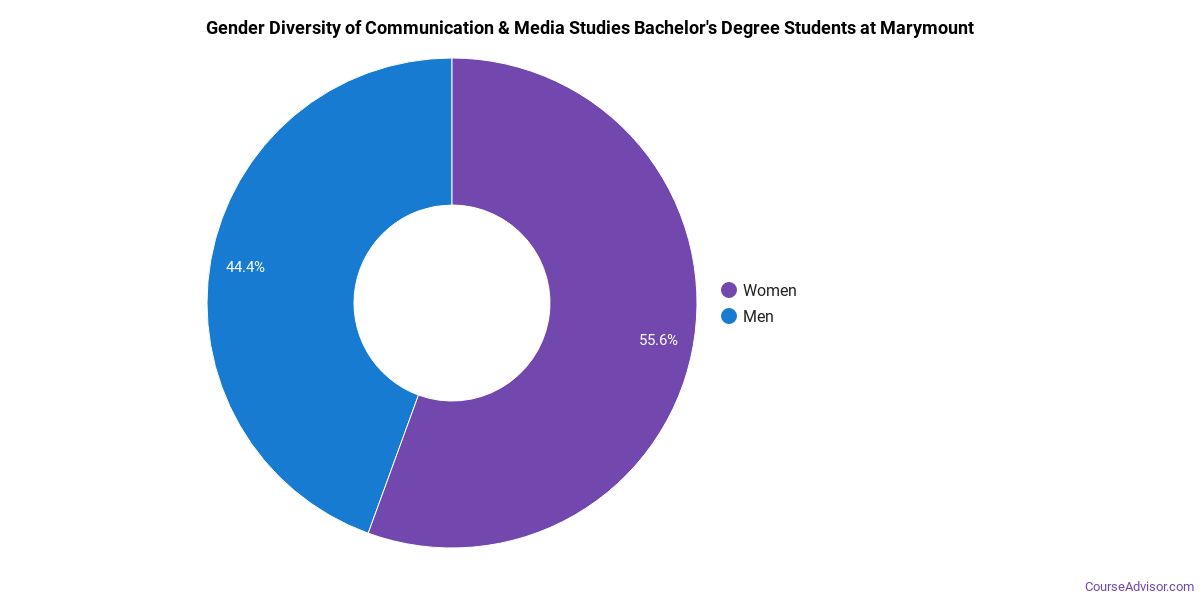
Across all degree levels, Communication & Media Studies graduates at Marymount University are 64% women (7) and 36% men (4).
Communication & Media Studies Bachelor’s Program at Marymount University
Among the 11 bachelor’s communication & media studies degrees awarded at Marymount University, 64% were women (7) and 36% were men (4).
The following table and chart show the race/ethnicity of Communication & Media Studies bachelor’s degree recipients at Marymount University.
| Race / Ethnicity | Number of Graduates |
|---|---|
| White | 2 |
| Hispanic / Latino | 4 |
| Black / African American | 2 |
| International (Nonresident) | 3 |
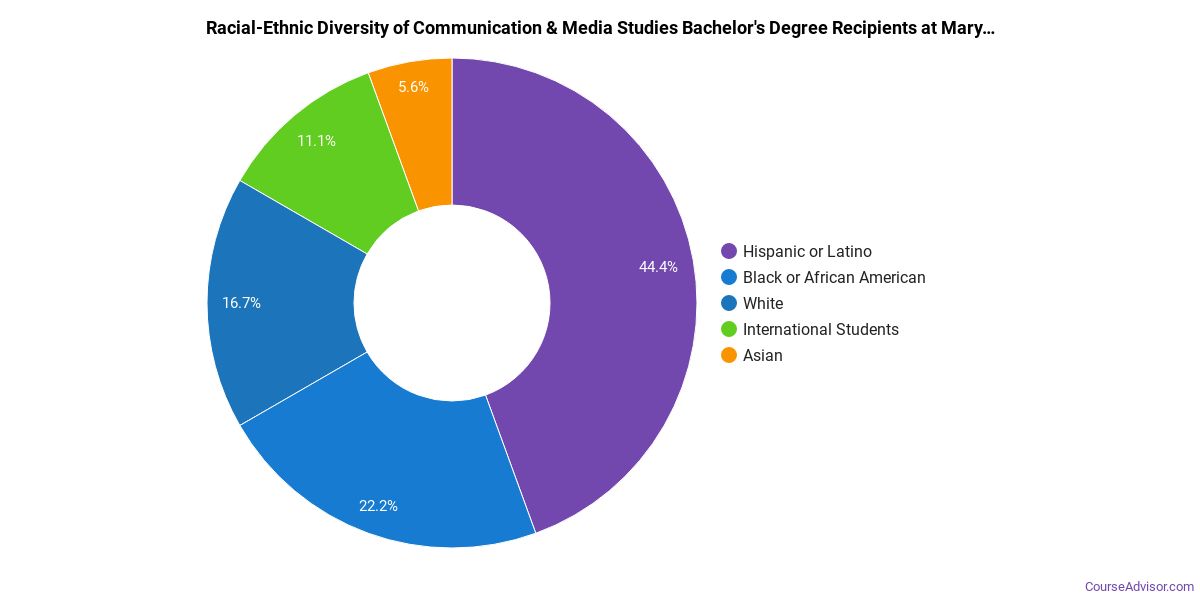
Racial-ethnic minorities make up 55% of Communication & Media Studies bachelor’s degree recipients at Marymount University, above the national average of 38%.*
*The racial-ethnic minorities figure is the total number of graduates minus White, international (nonresident), and unknown-race graduates.
More Specific Communication & Media Studies Concentrations at Marymount University
The Communication & Media Studies program at Marymount University breaks down into more specific concentrations:
| Concentration | Graduates |
|---|---|
| Communications | 11 |
Best-Paid Careers for Communication & Media Studies Graduates
Graduates of the Communication & Media Studies program at Marymount University go on to a range of careers. Below are the top-paying careers for Communication & Media Studies majors, ordered by median annual salary:
| Occupation | Nationwide Median Wage |
|---|---|
| Public Relations Managers | $139,736 |
| Fundraisers | $118,069 |
| Broadcast Announcers and Radio Disc Jockeys | $108,419 |
| Public Relations Specialists | $103,749 |
| Editors | $100,346 |
| Communications Teachers, Postsecondary | $96,169 |
| Fundraising Managers | $90,350 |
| News Analysts, Reporters, and Journalists | $74,101 |
| Poets, Lyricists and Creative Writers | $70,619 |
| Media and Communication Workers, All Other | $69,171 |
References
- IPEDS — Integrated Postsecondary Education Data System
- U.S. Department of Education — College Scorecard
- O*NET Online (Bureau of Labor Statistics)
- National Center for Education Statistics
More about our data sources and methodologies.
Course Advisor provides higher-education, college and university, degree, program, career, salary, and other helpful information to students, faculty, institutions, and other internet audiences. Presented information and data are subject to change. Inclusion on this website does not imply or represent a direct relationship with the company, school, or brand. Information, though believed correct at time of publication, may not be correct, and no warranty is provided. Contact the schools to verify any information before relying on it. Financial aid may be available for those who qualify. The displayed options may include sponsored or recommended results, not necessarily based on your preferences.
© Course Advisor – All Rights Reserved.