Electronics Engineering at Lorain County Community College
What traits are you looking for in a school for Electronics Engineering, consider the program at Lorain County Community College. We’ve gathered the following information to help you decide.
Lorain County Community College is in Elyria, OH.
During the most recent reporting year, 60 electronics engineering degrees were awarded at Lorain County Community College.
Featured schools near , edit
Studying Online at Lorain County Community College
Online coursework is an option at Lorain County Community College. Of 9,350 students, 2,548 (27%) were enrolled entirely in distance education and 2,866 (31%) took at least some classes online.
Electronics Engineering Rankings at Lorain County Community College
Use these rankings to compare Lorain County Community College’s Electronics Engineering program against other schools offering the same major.
Bachelor’s-Level Rankings
| Ranking | Scope | Rank |
|---|---|---|
| Best Value | Ohio | #1 of 13 |
| Best Value | Great Lakes (Region) | #3 of 39 |
| Best Schools (Quality) | Ohio | #11 of 12 |
| Best Value | Nationwide | #25 of 167 |
| Best Schools (Quality) | Great Lakes (Region) | #30 of 38 |
| Best Schools (Quality) | Nationwide | #108 of 168 |
Associate-Level Rankings
| Ranking | Scope | Rank |
|---|---|---|
| Best Value | Ohio | #1 of 13 |
| Best Value | Great Lakes (Region) | #3 of 39 |
| Best Schools (Quality) | Ohio | #11 of 12 |
| Best Value | Nationwide | #25 of 167 |
| Best Schools (Quality) | Great Lakes (Region) | #30 of 38 |
| Best Schools (Quality) | Nationwide | #108 of 168 |
Student Demographics & Diversity
Take a look at the composition of Electronics Engineering graduates at Lorain County Community College, by degree type.
Looking at the program as a whole, Electronics Engineering graduates at Lorain County Community College are 17% women (10) and 83% men (50).
Electronics Engineering Associate’s Program at Lorain County Community College
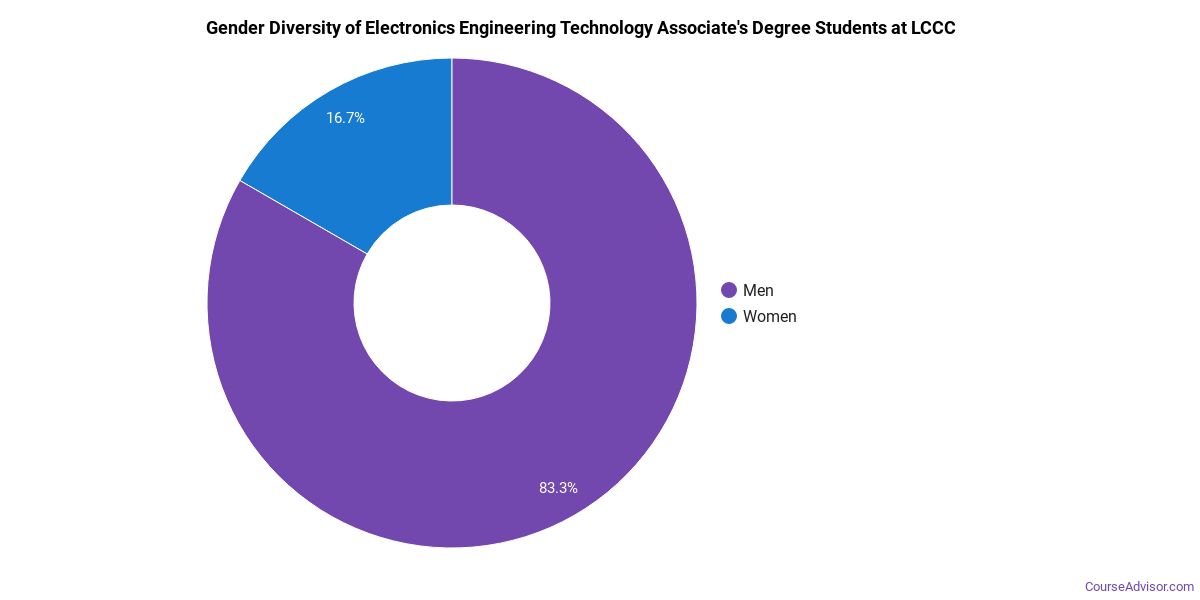
Among the 21 associate’s electronics engineering degrees awarded at Lorain County Community College, 19% were women (4) and 81% were men (17).
The following table and chart show the race/ethnicity of Electronics Engineering associate’s degree recipients at Lorain County Community College.
| Race / Ethnicity | Number of Graduates |
|---|---|
| White | 18 |
| Hispanic / Latino | 1 |
| Asian | 1 |
| International (Nonresident) | 1 |
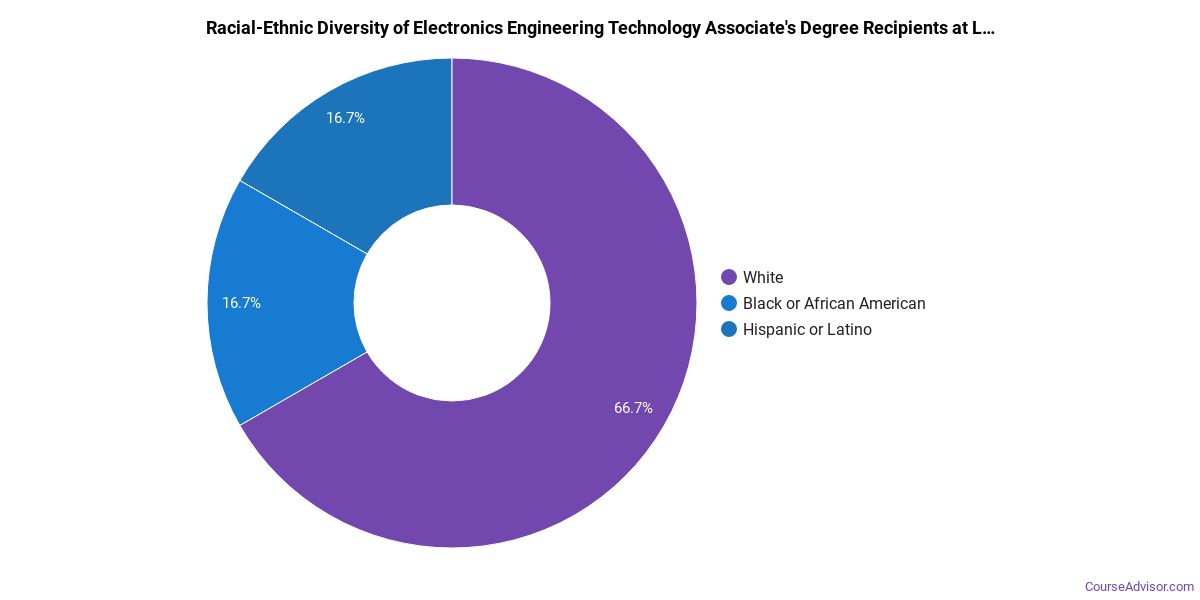
Minority students account for 10% of Electronics Engineering associate’s degree recipients at Lorain County Community College, lower than the national average of 39%.*
Electronics Engineering Bachelor’s Program at Lorain County Community College
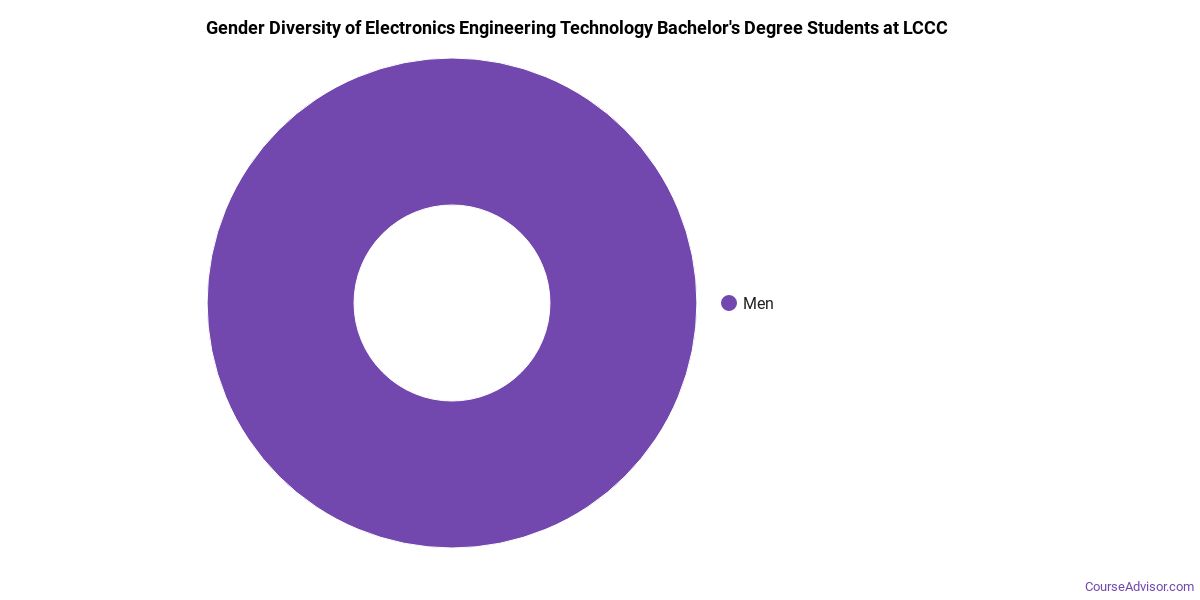
Among the 8 bachelor’s electronics engineering graduates at Lorain County Community College, 25% were women (2) and 75% were men (6).
The following table and chart show the race/ethnicity of Electronics Engineering bachelor’s degree recipients at Lorain County Community College.
| Race / Ethnicity | Number of Graduates |
|---|---|
| White | 8 |
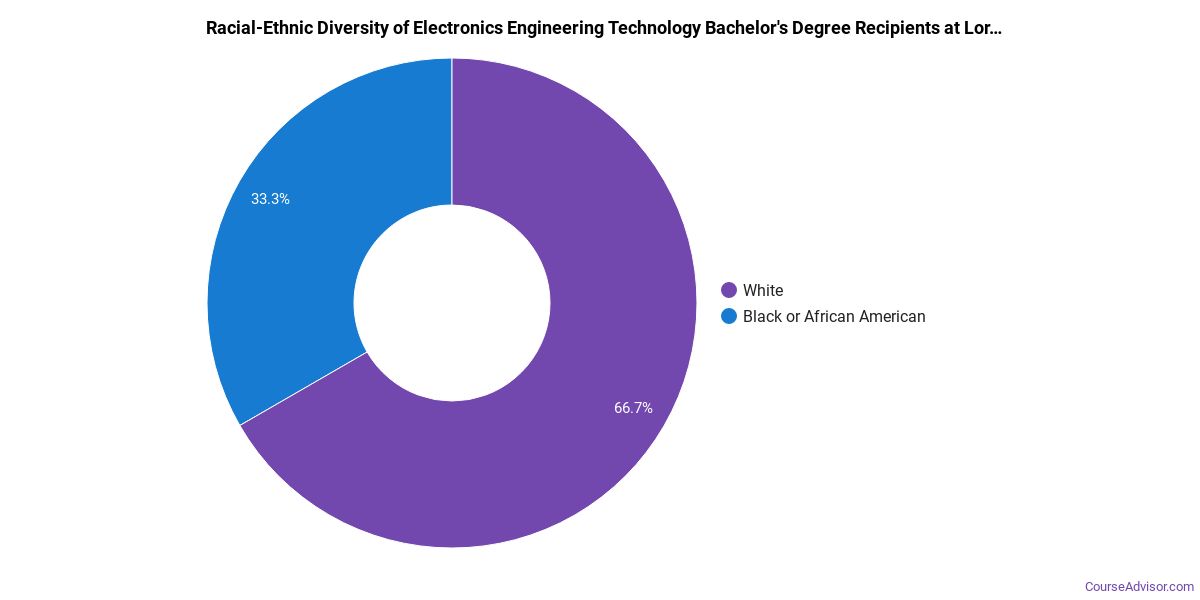
*The racial-ethnic minorities figure is the total number of graduates minus White, international (nonresident), and unknown-race graduates.
More Specific Electronics Engineering Concentrations at Lorain County Community College
The Electronics Engineering program at Lorain County Community College offers more specialized concentrations:
| Concentration | Graduates |
|---|---|
| Electronics Engineering Technology | 8 |
| Other Electrical Engineering | 52 |
Best-Paid Careers for Electronics Engineering Graduates
Students who finish Electronics Engineering program at Lorain County Community College work across a variety of fields. Here are the top-paying careers for Electronics Engineering graduates, ordered by median annual salary:
| Occupation | Nationwide Median Wage |
|---|---|
| Electro-Mechanical and Mechatronics Technologists and Technicians | $134,632 |
| Robotics Technicians | $131,252 |
| Engineering Technologists and Technicians, Except Drafters, All Other | $121,642 |
| Electrical and Electronics Drafters | $109,781 |
| Photonics Technicians | $106,964 |
| Calibration Technologists and Technicians | $92,586 |
| Electrical and Electronics Repairers, Powerhouse, Substation, and Relay | $89,975 |
| Disc Jockeys, Except Radio | $87,328 |
| Aerospace Engineering and Operations Technologists and Technicians | $77,835 |
| Sound Engineering Technicians | $66,427 |
References
- IPEDS — Integrated Postsecondary Education Data System
- U.S. Department of Education — College Scorecard
- O*NET Online (Bureau of Labor Statistics)
- National Center for Education Statistics
More about our data sources and methodologies.
Course Advisor provides higher-education, college and university, degree, program, career, salary, and other helpful information to students, faculty, institutions, and other internet audiences. Presented information and data are subject to change. Inclusion on this website does not imply or represent a direct relationship with the company, school, or brand. Information, though believed correct at time of publication, may not be correct, and no warranty is provided. Contact the schools to verify any information before relying on it. Financial aid may be available for those who qualify. The displayed options may include sponsored or recommended results, not necessarily based on your preferences.
© Course Advisor – All Rights Reserved.