Teacher Education Subject Specific at Linfield University
What traits are you looking for in a school for Teacher Education Subject Specific, consider the program at Linfield University. We’ve gathered the following information to help you decide.
Linfield University sits in McMinnville, OR.
In the most recent year for which we have data, 1 teacher education subject specific degrees were granted at Linfield University.
Featured schools near , edit
Studying Online at Linfield University
Many students take online classes at Linfield University. Among 1,709 students, 105 (6%) were enrolled entirely in distance education and 286 (17%) took at least some classes online.
Teacher Education Subject Specific Rankings at Linfield University
These rankings give you a sense of how Linfield University’s Teacher Education Subject Specific program against other schools offering the same major.
Median Debt at Graduation
Median student loan debt for Teacher Education Subject Specific graduates from Linfield University comes in at $27,000.
Student Demographics & Diversity
Below you’ll find the student demographics for Teacher Education Subject Specific graduates at Linfield University, by degree type.
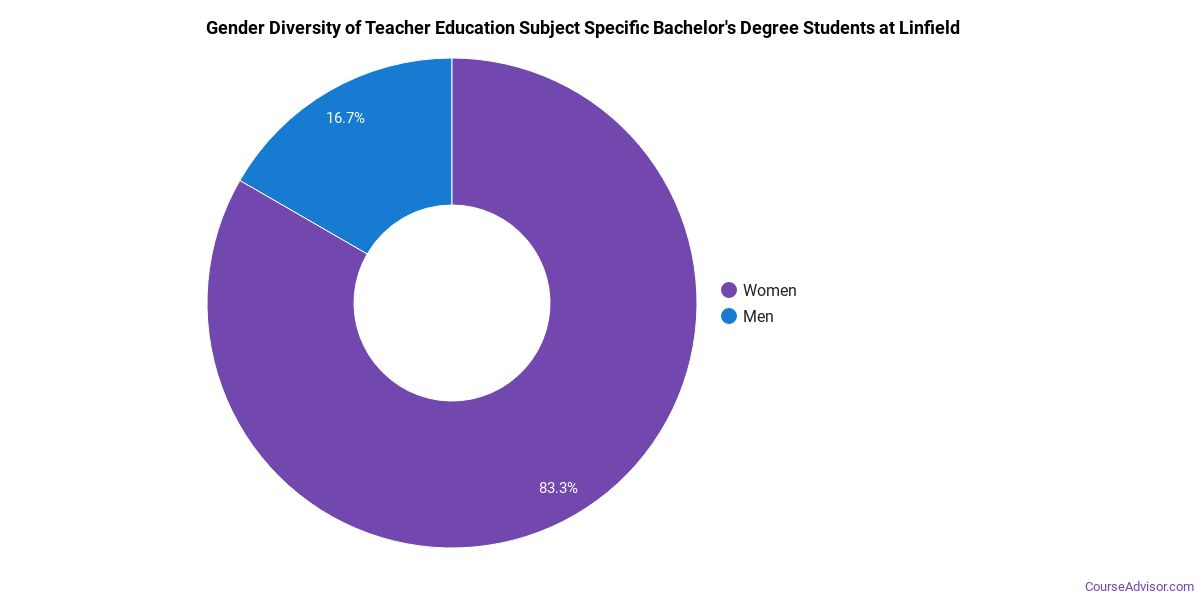
Across all degree levels, Teacher Education Subject Specific graduates at Linfield University are 0% women (0) and 100% men (1).
Teacher Education Subject Specific Bachelor’s Program at Linfield University
Of the 1 bachelor’s teacher education subject specific degrees awarded at Linfield University, 0% were women (0) and 100% were men (1).
The following table and chart show the race/ethnicity of Teacher Education Subject Specific bachelor’s degree recipients at Linfield University.
| Race / Ethnicity | Number of Graduates |
|---|---|
| White | 1 |
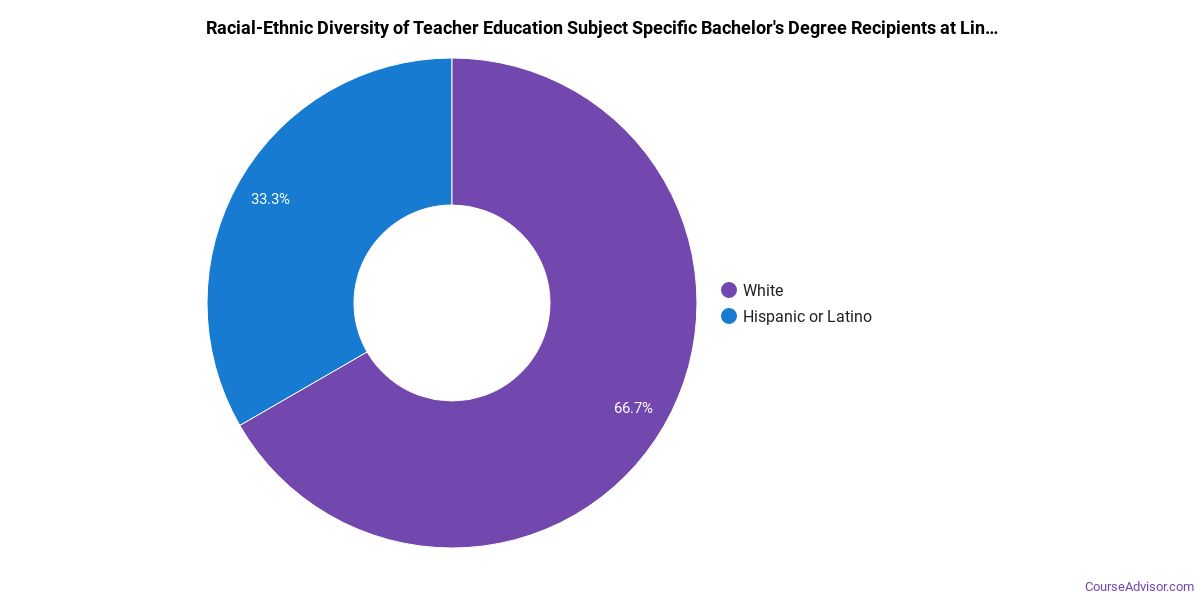
*The racial-ethnic minorities figure is the total number of graduates minus White, international (nonresident), and unknown-race graduates.
More Specific Teacher Education Subject Specific Concentrations at Linfield University
This Teacher Education Subject Specific program at Linfield University includes the following sub-specializations:
| Concentration | Graduates |
|---|---|
| Physical Education & Coaching | 1 |
Best-Paid Careers for Teacher Education Subject Specific Graduates
Graduates of the Teacher Education Subject Specific program at Linfield University work across a variety of fields. Below are the top-paying careers for Teacher Education Subject Specific majors, ordered by median annual salary:
| Occupation | Nationwide Median Wage |
|---|---|
| Family and Consumer Sciences Teachers, Postsecondary | $99,604 |
| Psychology Teachers, Postsecondary | $98,479 |
| Education Teachers, Postsecondary | $98,329 |
| English Language and Literature Teachers, Postsecondary | $88,437 |
| Career/Technical Education Teachers, Postsecondary | $86,398 |
| Recreation and Fitness Studies Teachers, Postsecondary | $84,688 |
| Teachers and Instructors, All Other | $83,682 |
| Environmental Science Teachers, Postsecondary | $83,485 |
| Middle School Teachers, Except Special and Career/Technical Education | $83,105 |
| Physics Teachers, Postsecondary | $80,685 |
References
- IPEDS — Integrated Postsecondary Education Data System
- U.S. Department of Education — College Scorecard
- O*NET Online (Bureau of Labor Statistics)
- National Center for Education Statistics
More about our data sources and methodologies.
Course Advisor provides higher-education, college and university, degree, program, career, salary, and other helpful information to students, faculty, institutions, and other internet audiences. Presented information and data are subject to change. Inclusion on this website does not imply or represent a direct relationship with the company, school, or brand. Information, though believed correct at time of publication, may not be correct, and no warranty is provided. Contact the schools to verify any information before relying on it. Financial aid may be available for those who qualify. The displayed options may include sponsored or recommended results, not necessarily based on your preferences.
© Course Advisor – All Rights Reserved.