Computer Science at Illinois State University
If you plan to study Computer Science, consider the program at Illinois State University. Get started with the following essential facts.
Illinois State University is in Normal, IL.
For the most recent IPEDS reporting year, 187 computer science graduations were recorded at Illinois State University.
Featured schools near , edit
Online & Distance Learning at Illinois State University
Online coursework is an option at Illinois State University. Of 21,546 students, 1,302 (6%) studied exclusively online and 7,853 (36%) took at least some classes online.
Computer Science Rankings at Illinois State University
These rankings give you a sense of how Illinois State University’s Computer Science program to other colleges that offer this major.
Bachelor’s-Level Rankings
| Ranking | Scope | Rank |
|---|---|---|
| Best Schools (Quality) | Illinois | #6 of 27 |
| Best Schools (Quality) | Great Lakes (Region) | #14 of 77 |
| Best Value | Illinois | #15 of 27 |
| Best Value | Great Lakes (Region) | #38 of 77 |
| Best Schools (Quality) | Nationwide | #148 of 637 |
| Best Value | Nationwide | #380 of 635 |
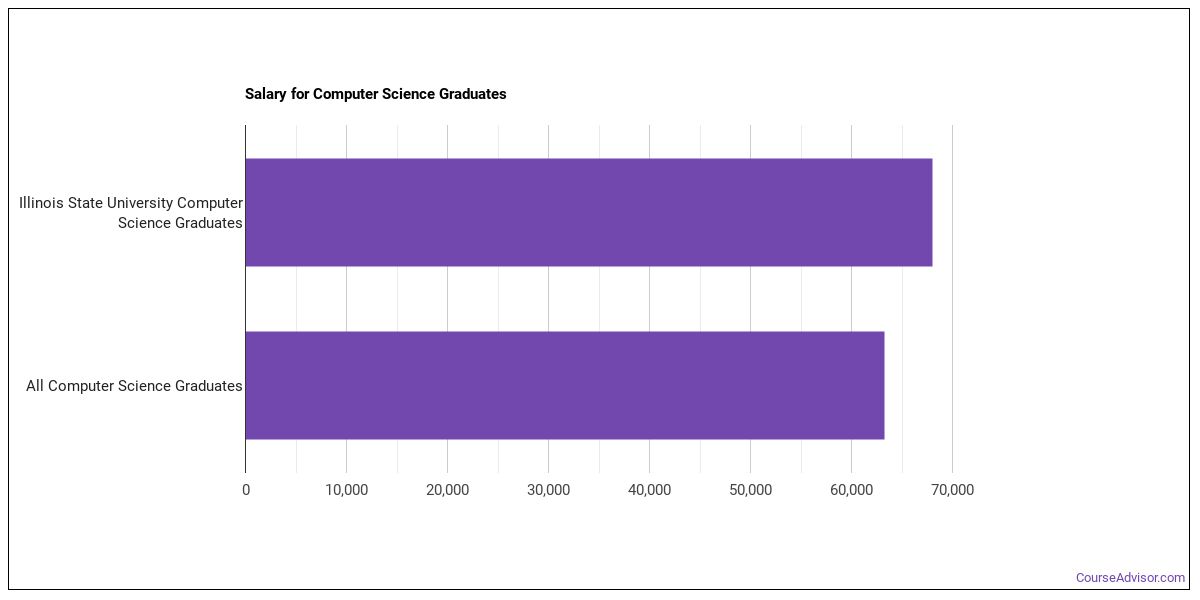
Earnings for Computer Science Graduates from Illinois State University
Students who complete Illinois State University’s Computer Science program report the following median earnings (per the U.S. Department of Education’s College Scorecard):
| Years After Graduation | Median Earnings |
|---|---|
| 1 year | $68,002 |
| 2 years | $64,990 |
| 3 years | $78,276 |
| 4 years | $89,443 |
| 5 years | $99,457 |
How do these earnings stack up against the rest of the school? Four years after graduating, Computer Science graduates from Illinois State University take home a median $89,443, compared with $58,604 for all Illinois State University graduates — about 53% higher than the school-wide median.

Median Debt at Graduation
Median student loan debt for Computer Science graduates from Illinois State University stands at $22,500.
Student Demographics & Diversity
The following sections describe the student demographics for Computer Science graduates at Illinois State University, by degree type.
Program-wide, Computer Science graduates at Illinois State University are 27% women (51) and 73% men (136).
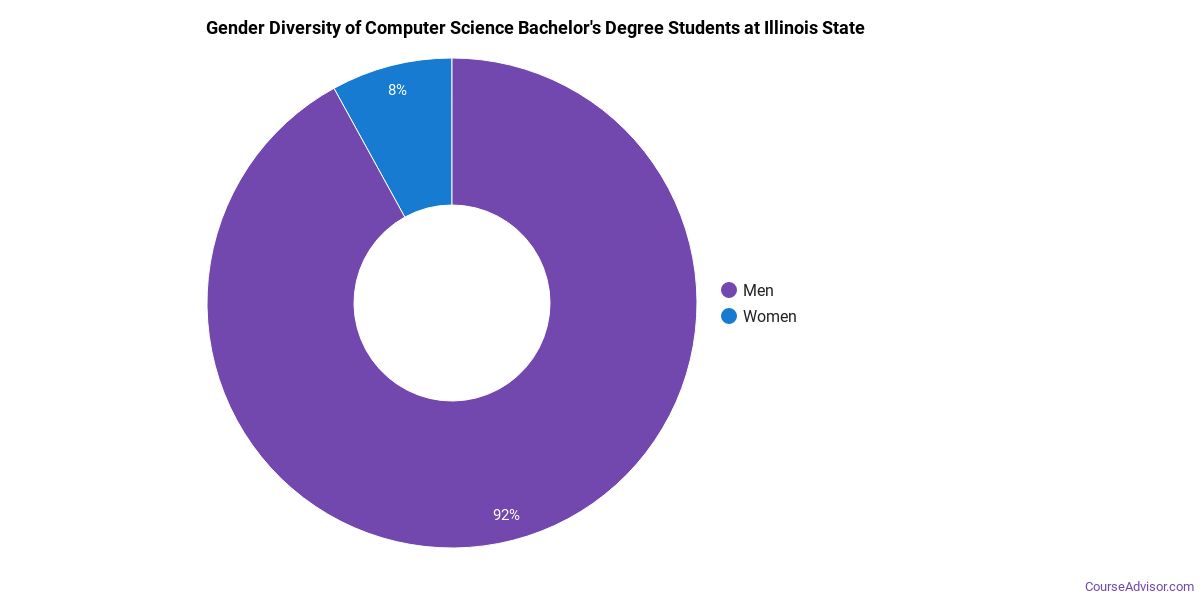
Computer Science Bachelor’s Program at Illinois State University
Of the 88 bachelor’s computer science graduates at Illinois State University, 10% were women (9) and 90% were men (79).
The following table and chart show the race/ethnicity of Computer Science bachelor’s degree recipients at Illinois State University.
| Race / Ethnicity | Number of Graduates |
|---|---|
| White | 65 |
| Hispanic / Latino | 8 |
| Black / African American | 3 |
| Asian | 6 |
| Two or More Races | 4 |
| International (Nonresident) | 2 |
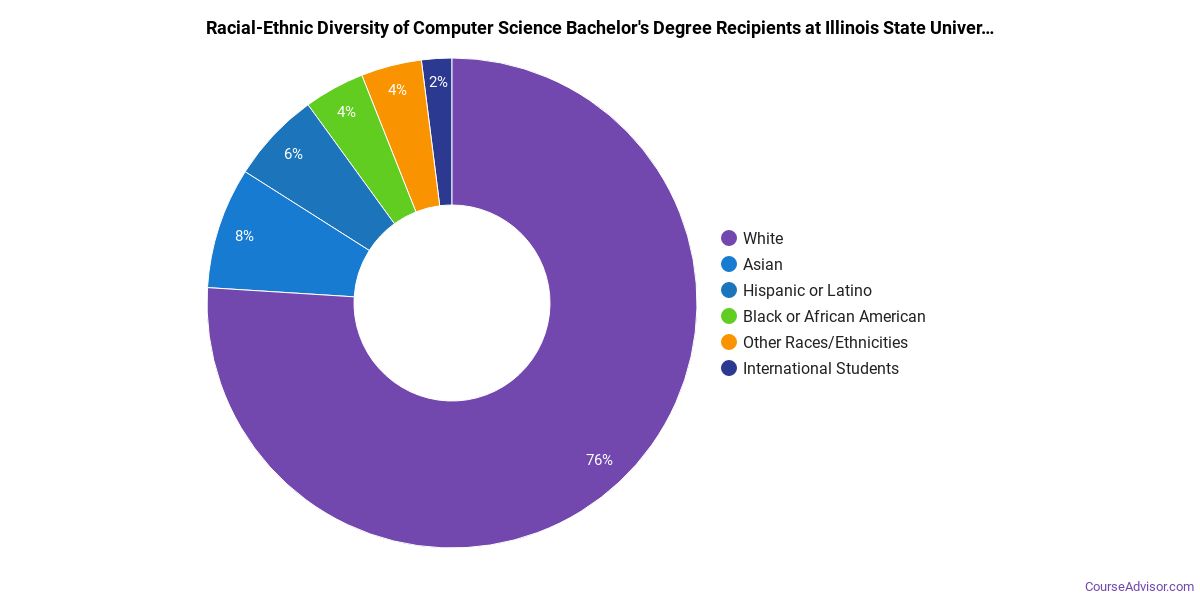
Racial-ethnic minorities make up 24% of Computer Science bachelor’s degree recipients at Illinois State University, lower than the national average of 47%.*
Computer Science Master’s Program at Illinois State University
Among the 99 master’s computer science graduates at Illinois State University, 42% were women (42) and 58% were men (57).

The following table and chart show the race/ethnicity of Computer Science master’s degree recipients at Illinois State University.
| Race / Ethnicity | Number of Graduates |
|---|---|
| White | 1 |
| International (Nonresident) | 98 |

*The racial-ethnic minorities figure is the total number of graduates minus White, international (nonresident), and unknown-race graduates.
More Specific Computer Science Concentrations at Illinois State University
The Computer Science program at Illinois State University offers more specialized concentrations:
| Concentration | Graduates |
|---|---|
| General Computer Science | 187 |
Highest-Paying Careers for Computer Science Graduates
Those who complete Computer Science program at Illinois State University work across a variety of fields. Below are the top-paying careers for Computer Science majors, ordered by median annual salary:
| Occupation | Nationwide Median Wage |
|---|---|
| Computer and Information Systems Managers | $175,079 |
| Computer Occupations, All Other | $159,837 |
| Database Architects | $148,480 |
| Document Management Specialists | $147,490 |
| Business Intelligence Analysts | $143,840 |
| Information Security Engineers | $142,543 |
| Computer Systems Engineers/Architects | $140,795 |
| Web Developers | $125,527 |
| Information Technology Project Managers | $124,655 |
| Blockchain Engineers | $123,667 |
References
- IPEDS — Integrated Postsecondary Education Data System
- U.S. Department of Education — College Scorecard
- O*NET Online (Bureau of Labor Statistics)
- National Center for Education Statistics
More about our data sources and methodologies.
Course Advisor provides higher-education, college and university, degree, program, career, salary, and other helpful information to students, faculty, institutions, and other internet audiences. Presented information and data are subject to change. Inclusion on this website does not imply or represent a direct relationship with the company, school, or brand. Information, though believed correct at time of publication, may not be correct, and no warranty is provided. Contact the schools to verify any information before relying on it. Financial aid may be available for those who qualify. The displayed options may include sponsored or recommended results, not necessarily based on your preferences.
© Course Advisor – All Rights Reserved.