Computer Science at Duquesne University
If you plan to study Computer Science, take a look at what Duquesne University. The following information will help you decide if it is a good fit for you.
Duquesne University is in Pittsburgh, PA.
During the most recent reporting year, 29 computer science degrees were awarded at Duquesne University.
Featured schools near , edit
Online Class Availability at Duquesne University
Many students take online classes at Duquesne University. Of 8,234 students, 561 (7%) studied exclusively online and 2,706 (33%) took at least some classes online.
Computer Science Rankings at Duquesne University
Rankings can help you compare Duquesne University’s Computer Science program against other schools offering the same major.
Bachelor’s-Level Rankings
| Ranking | Scope | Rank |
|---|---|---|
| Best Schools (Quality) | Pennsylvania | #15 of 32 |
| Best Value | Pennsylvania | #27 of 32 |
| Best Schools (Quality) | Middle Atlantic (Region) | #61 of 112 |
| Best Value | Middle Atlantic (Region) | #98 of 111 |
| Best Schools (Quality) | Nationwide | #312 of 637 |
| Best Value | Nationwide | #591 of 635 |
Master’s-Level Rankings
| Ranking | Scope | Rank |
|---|---|---|
| Best Schools (Quality) | Pennsylvania | #15 of 32 |
| Best Value | Pennsylvania | #27 of 32 |
| Best Schools (Quality) | Middle Atlantic (Region) | #61 of 112 |
| Best Value | Middle Atlantic (Region) | #98 of 111 |
| Best Schools (Quality) | Nationwide | #312 of 637 |
| Best Value | Nationwide | #591 of 635 |
Median Debt at Graduation
The median debt for Computer Science graduates from Duquesne University stands at $26,950.
Student Demographics & Diversity
The following sections describe the composition of Computer Science graduates at Duquesne University, broken down by degree level.
Across all degree levels, Computer Science graduates at Duquesne University are 24% women (7) and 76% men (22).
Computer Science Bachelor’s Program at Duquesne University
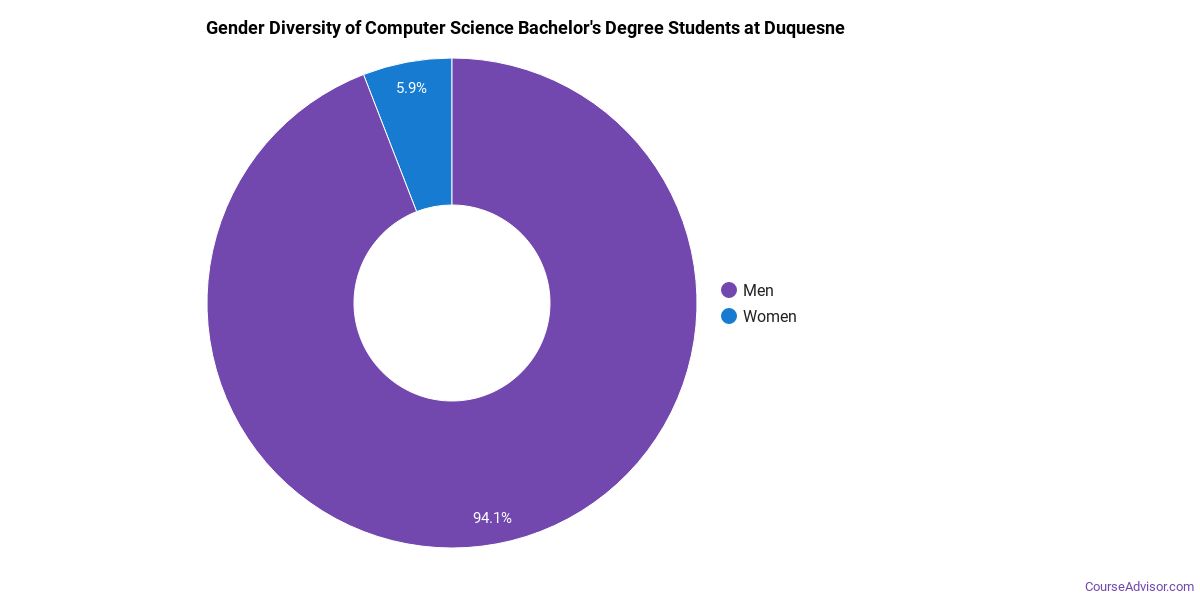
Among the 17 bachelor’s computer science degrees awarded at Duquesne University, 29% were women (5) and 71% were men (12).
The following table and chart show the race/ethnicity of Computer Science bachelor’s degree recipients at Duquesne University.
| Race / Ethnicity | Number of Graduates |
|---|---|
| White | 11 |
| Hispanic / Latino | 1 |
| Asian | 1 |
| Two or More Races | 1 |
| International (Nonresident) | 2 |
| Unknown | 1 |
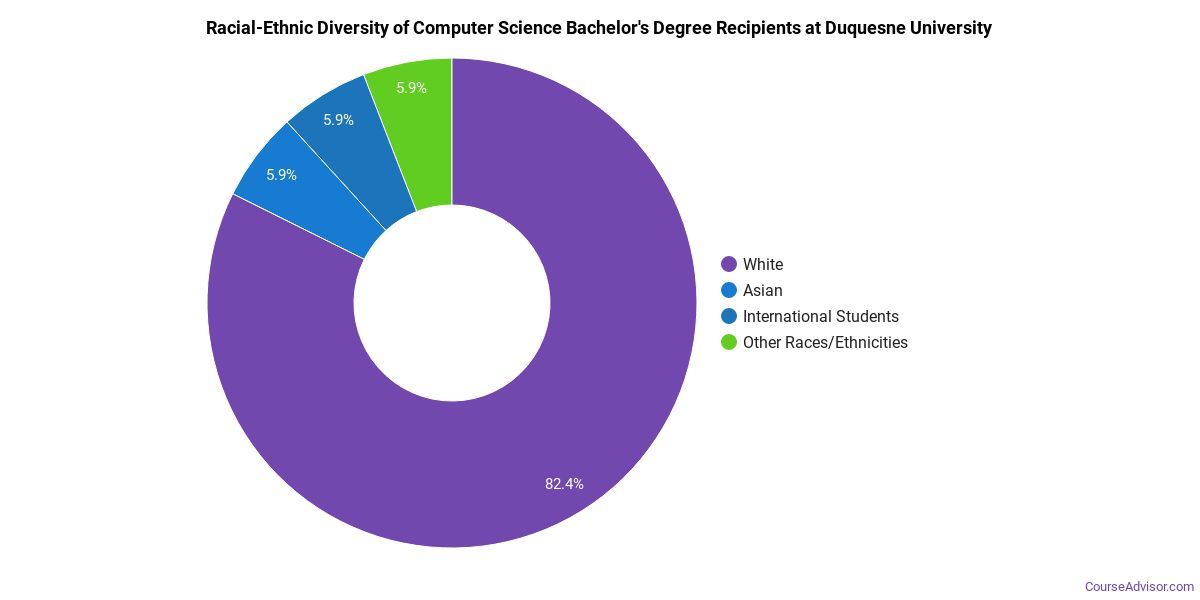
Minority students account for 18% of Computer Science bachelor’s degree recipients at Duquesne University, lower than the national average of 47%.*
Computer Science Master’s Program at Duquesne University
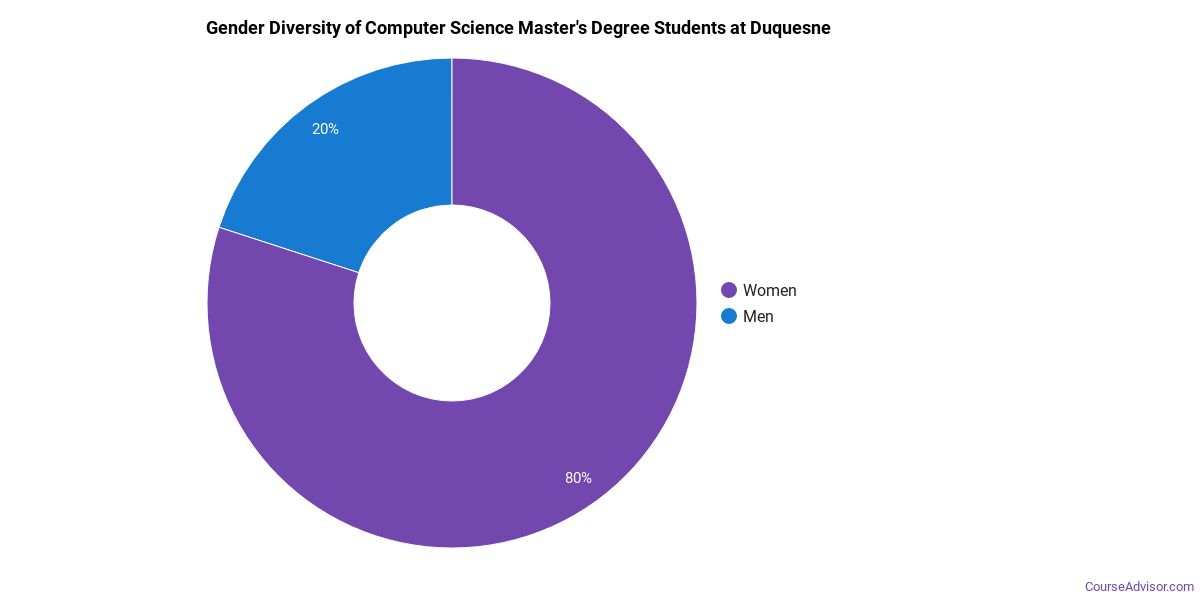
Among the 12 master’s computer science degrees awarded at Duquesne University, 17% were women (2) and 83% were men (10).
The following table and chart show the race/ethnicity of Computer Science master’s degree recipients at Duquesne University.
| Race / Ethnicity | Number of Graduates |
|---|---|
| White | 1 |
| Two or More Races | 2 |
| International (Nonresident) | 9 |
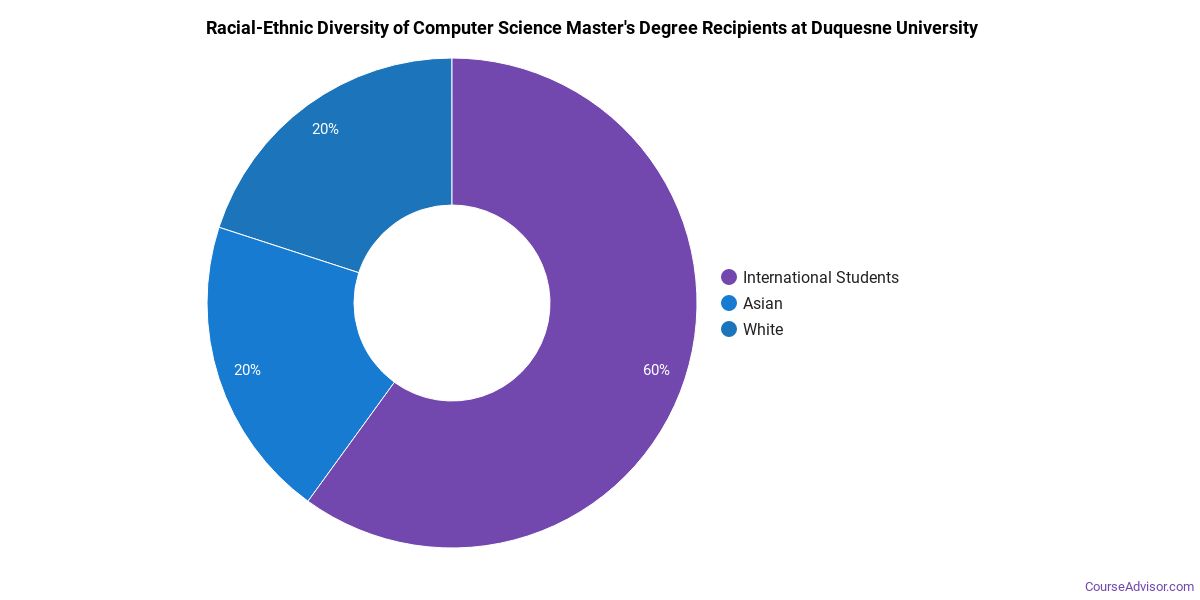
Minority students account for 17% of Computer Science master’s degree recipients at Duquesne University, higher than the national average of 12%.*
*The racial-ethnic minorities figure is the total number of graduates minus White, international (nonresident), and unknown-race graduates.
More Specific Computer Science Concentrations at Duquesne University
This Computer Science program at Duquesne University breaks down into more specific concentrations:
| Concentration | Graduates |
|---|---|
| General Computer Science | 29 |
Best-Paid Careers for Computer Science Graduates
Graduates of the Computer Science program at Duquesne University work across a variety of fields. Below are the highest-paying careers for Computer Science graduates, ordered by median annual salary:
| Occupation | Nationwide Median Wage |
|---|---|
| Computer and Information Systems Managers | $175,079 |
| Computer Occupations, All Other | $159,837 |
| Database Architects | $148,480 |
| Document Management Specialists | $147,490 |
| Business Intelligence Analysts | $143,840 |
| Information Security Engineers | $142,543 |
| Computer Systems Engineers/Architects | $140,795 |
| Web Developers | $125,527 |
| Information Technology Project Managers | $124,655 |
| Blockchain Engineers | $123,667 |
References
- IPEDS — Integrated Postsecondary Education Data System
- U.S. Department of Education — College Scorecard
- O*NET Online (Bureau of Labor Statistics)
- National Center for Education Statistics
More about our data sources and methodologies.
Course Advisor provides higher-education, college and university, degree, program, career, salary, and other helpful information to students, faculty, institutions, and other internet audiences. Presented information and data are subject to change. Inclusion on this website does not imply or represent a direct relationship with the company, school, or brand. Information, though believed correct at time of publication, may not be correct, and no warranty is provided. Contact the schools to verify any information before relying on it. Financial aid may be available for those who qualify. The displayed options may include sponsored or recommended results, not necessarily based on your preferences.
© Course Advisor – All Rights Reserved.