Industrial Engineering at California State Polytechnic University-Pomona
If you are interested in studying Industrial Engineering, take a look at what California State Polytechnic University-Pomona. We’ve gathered the following information to help you decide.
California State Polytechnic University-Pomona is in Pomona, CA.
In the most recent year for which we have data, 64 industrial engineering degrees were awarded at California State Polytechnic University-Pomona.
Featured schools near , edit
Online Class Availability at California State Polytechnic University-Pomona
Distance learning is available at California State Polytechnic University-Pomona. Of 27,636 students, 742 (3%) were enrolled entirely in distance education and 14,977 (54%) took at least some classes online.
Industrial Engineering Rankings at California State Polytechnic University-Pomona
Rankings can help you compare California State Polytechnic University-Pomona’s Industrial Engineering program against peer institutions.
Bachelor’s-Level Rankings
| Ranking | Scope | Rank |
|---|---|---|
| Best Value | California | #2 of 6 |
| Best Value | Far Western (Region) | #2 of 8 |
| Best Schools (Quality) | California | #4 of 6 |
| Best Schools (Quality) | Far Western (Region) | #5 of 8 |
| Best Value | Nationwide | #7 of 102 |
| Best Schools (Quality) | Nationwide | #36 of 102 |
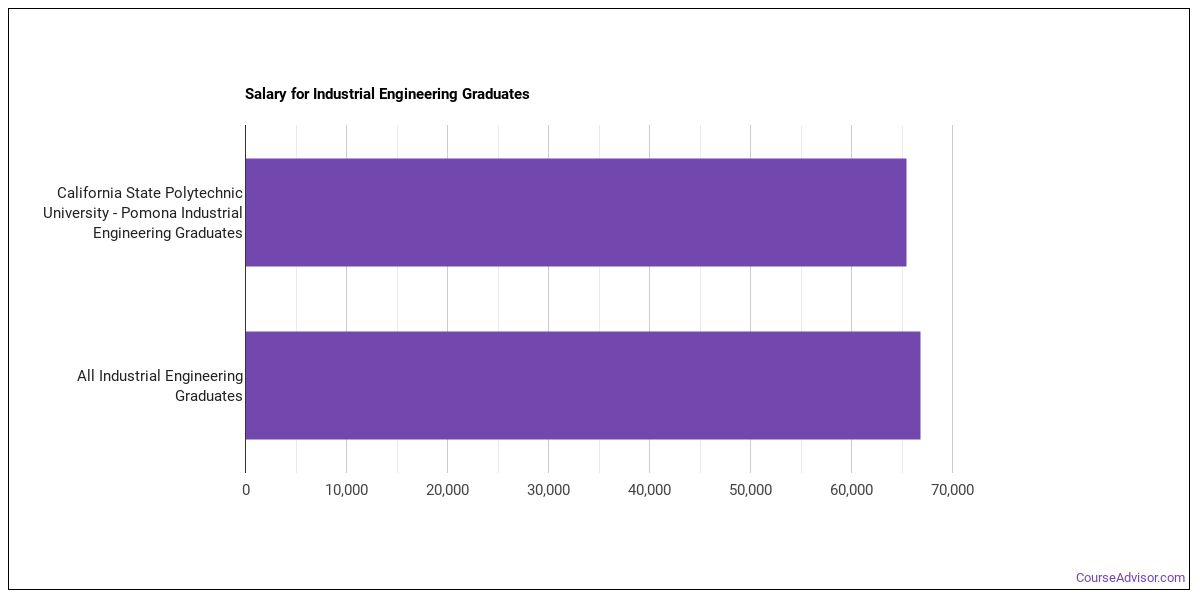
Earnings for Industrial Engineering Graduates from California State Polytechnic University-Pomona
Graduates of California State Polytechnic University-Pomona’s Industrial Engineering program earn at the following median levels (per the U.S. Department of Education’s College Scorecard):
| Years After Graduation | Median Earnings |
|---|---|
| 1 year | $65,420 |
| 2 years | $67,287 |
| 3 years | $75,414 |
| 4 years | $86,122 |
| 5 years | $95,032 |
Is this above or below average for the school? At the four-year mark, Industrial Engineering graduates from California State Polytechnic University-Pomona earn a median of $86,122, compared with $71,805 for all California State Polytechnic University-Pomona graduates — about 20% higher than the school-wide median.

Median Debt at Graduation
Median student loan debt for Industrial Engineering graduates from California State Polytechnic University-Pomona stands at $25,000.
Student Demographics & Diversity
Below you’ll find the composition of Industrial Engineering graduates at California State Polytechnic University-Pomona, broken down by degree level.
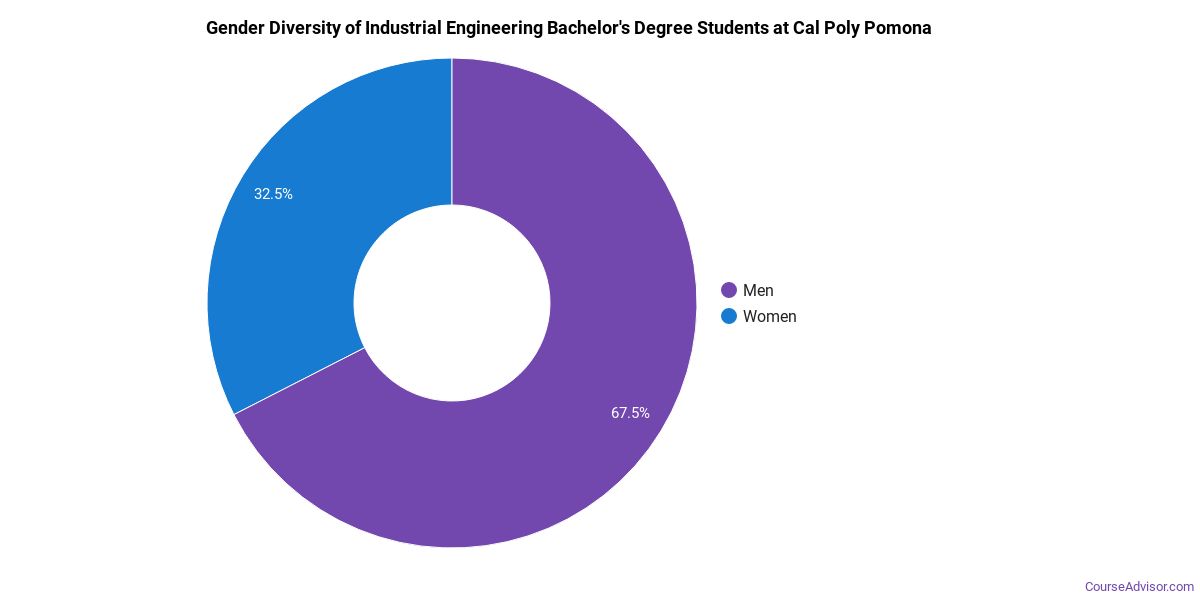
Program-wide, Industrial Engineering graduates at California State Polytechnic University-Pomona are 20% women (13) and 80% men (51).
Industrial Engineering Bachelor’s Program at California State Polytechnic University-Pomona
Among the 64 bachelor’s industrial engineering degrees awarded at California State Polytechnic University-Pomona, 20% were women (13) and 80% were men (51).
The following table and chart show the race/ethnicity of Industrial Engineering bachelor’s degree recipients at California State Polytechnic University-Pomona.
| Race / Ethnicity | Number of Graduates |
|---|---|
| White | 10 |
| Hispanic / Latino | 19 |
| Black / African American | 2 |
| Asian | 21 |
| Two or More Races | 1 |
| International (Nonresident) | 9 |
| Unknown | 2 |
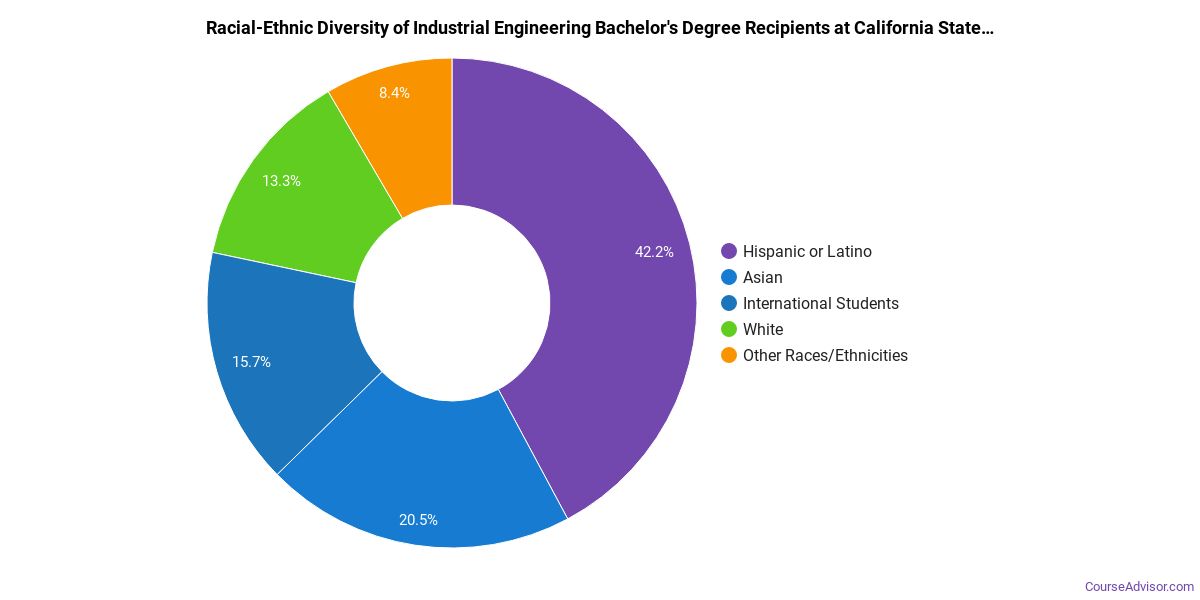
Minority students account for 67% of Industrial Engineering bachelor’s degree recipients at California State Polytechnic University-Pomona, higher than the national average of 36%.*
*The racial-ethnic minorities figure is the total number of graduates minus White, international (nonresident), and unknown-race graduates.
More Specific Industrial Engineering Concentrations at California State Polytechnic University-Pomona
This Industrial Engineering program at California State Polytechnic University-Pomona offers more specialized concentrations:
| Concentration | Graduates |
|---|---|
| General Industrial Engineering | 64 |
Top-Paying Careers for Industrial Engineering Graduates
Those who complete Industrial Engineering program at California State Polytechnic University-Pomona pursue many career paths. Below are the highest-paying careers for Industrial Engineering graduates, ordered by median annual salary:
| Occupation | Nationwide Median Wage |
|---|---|
| Biofuels Production Managers | $164,096 |
| Geothermal Production Managers | $160,381 |
| Biomass Power Plant Managers | $146,025 |
| Human Factors Engineers and Ergonomists | $128,495 |
| Industrial Production Managers | $126,666 |
| Industrial Engineers | $120,863 |
| Quality Control Systems Managers | $108,531 |
| Architectural and Engineering Managers | $101,277 |
| Manufacturing Engineers | $91,427 |
| Hydroelectric Production Managers | $91,208 |
References
- IPEDS — Integrated Postsecondary Education Data System
- U.S. Department of Education — College Scorecard
- O*NET Online (Bureau of Labor Statistics)
- National Center for Education Statistics
More about our data sources and methodologies.
Course Advisor provides higher-education, college and university, degree, program, career, salary, and other helpful information to students, faculty, institutions, and other internet audiences. Presented information and data are subject to change. Inclusion on this website does not imply or represent a direct relationship with the company, school, or brand. Information, though believed correct at time of publication, may not be correct, and no warranty is provided. Contact the schools to verify any information before relying on it. Financial aid may be available for those who qualify. The displayed options may include sponsored or recommended results, not necessarily based on your preferences.
© Course Advisor – All Rights Reserved.