Behavioral Science at Brown University
If you are interested in studying Behavioral Science, take a look at what Brown University. Get started with the following essential facts.
Brown University is located in Providence, RI.
For the most recent IPEDS reporting year, 47 behavioral science degrees were granted at Brown University.
Featured schools near , edit
Online & Distance Learning at Brown University
Distance learning is available at Brown University. Of 11,956 students, 758 (6%) studied exclusively online and 238 (2%) took at least some classes online.
Student Demographics & Diversity
Take a look at the student demographics for Behavioral Science graduates at Brown University, by degree type.
Program-wide, Behavioral Science graduates at Brown University are 64% women (30) and 36% men (17).
Behavioral Science Bachelor’s Program at Brown University
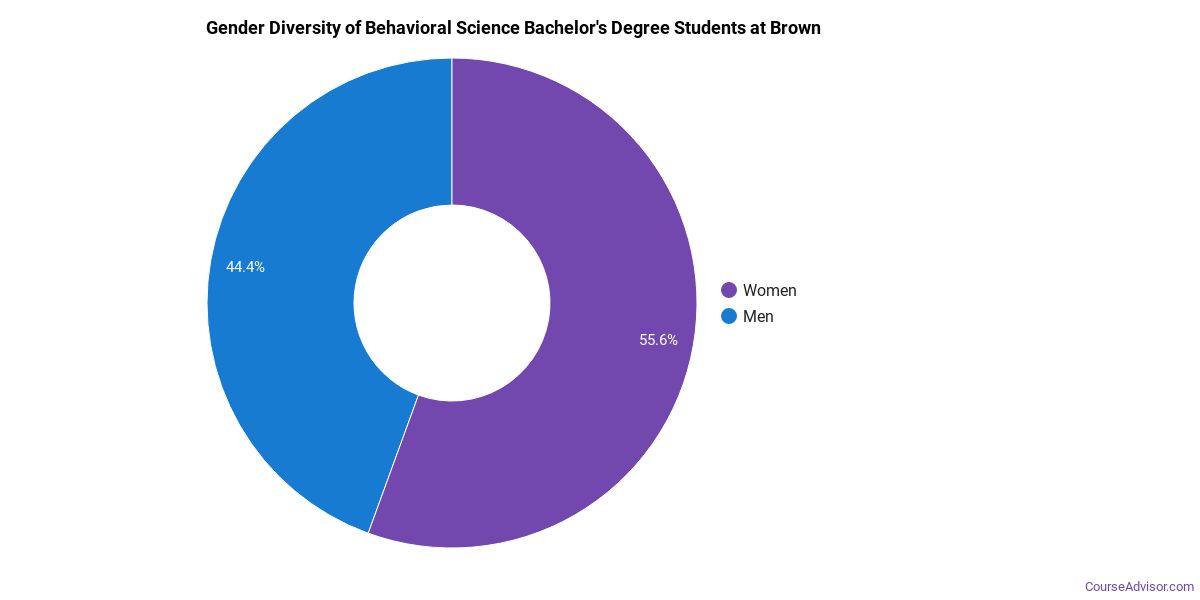
Among the 37 bachelor’s behavioral science graduates at Brown University, 59% were women (22) and 41% were men (15).
The following table and chart show the race/ethnicity of Behavioral Science bachelor’s degree recipients at Brown University.
| Race / Ethnicity | Number of Graduates |
|---|---|
| White | 16 |
| Hispanic / Latino | 1 |
| Black / African American | 2 |
| Asian | 3 |
| Two or More Races | 4 |
| International (Nonresident) | 11 |
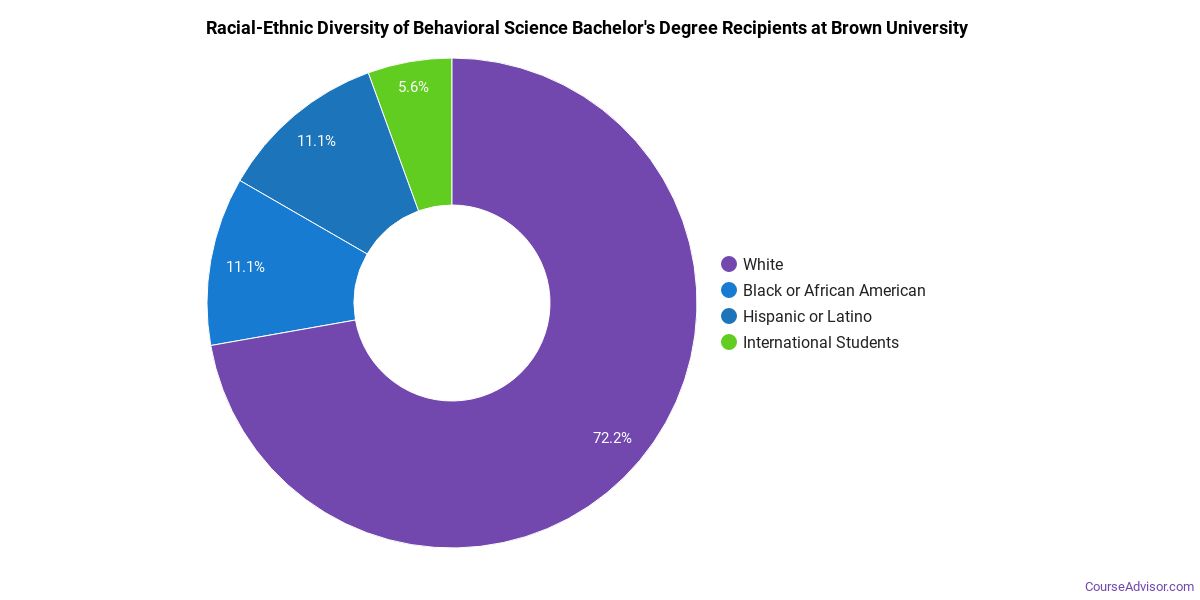
Racial-ethnic minorities make up 27% of Behavioral Science bachelor’s degree recipients at Brown University, lower than the national average of 44%.*
Behavioral Science Master’s Program at Brown University
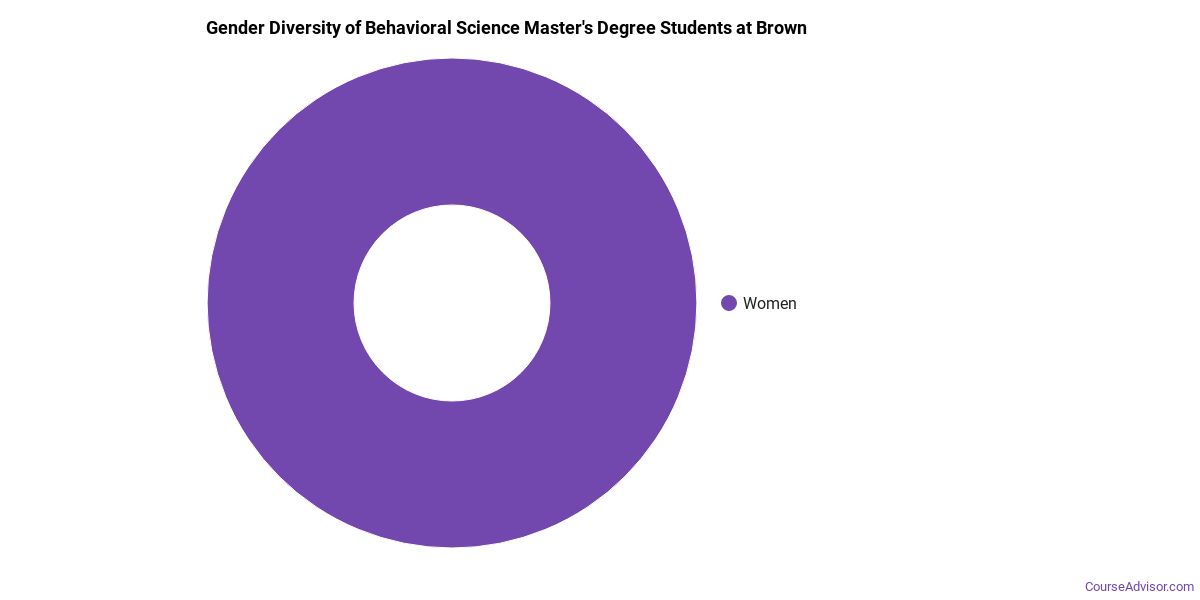
Of the 8 master’s behavioral science degrees awarded at Brown University, 88% were women (7) and 12% were men (1).
The following table and chart show the race/ethnicity of Behavioral Science master’s degree recipients at Brown University.
| Race / Ethnicity | Number of Graduates |
|---|---|
| White | 2 |
| Hispanic / Latino | 1 |
| International (Nonresident) | 5 |
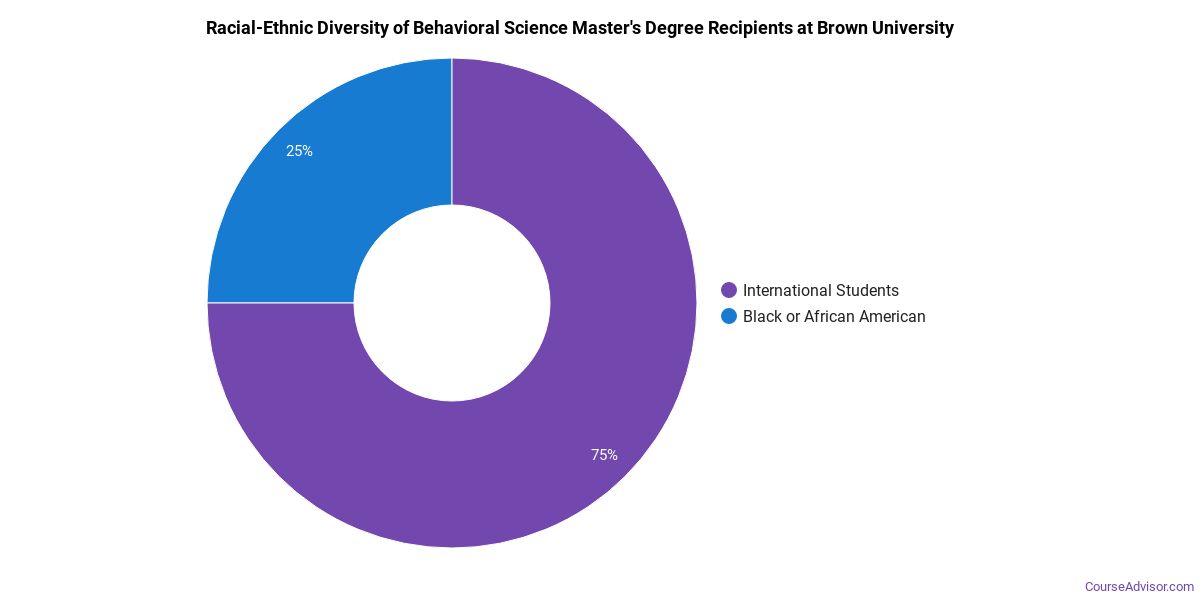
Racial-ethnic minorities make up 12% of Behavioral Science master’s degree recipients at Brown University, lower than the national average of 36%.*
Behavioral Science Doctoral Program at Brown University
Among the 2 doctoral behavioral science degrees awarded at Brown University, 50% were women (1) and 50% were men (1).

The following table and chart show the race/ethnicity of Behavioral Science doctoral degree recipients at Brown University.
| Race / Ethnicity | Number of Graduates |
|---|---|
| White | 1 |
| Black / African American | 1 |

Racial-ethnic minorities make up 50% of Behavioral Science doctoral degree recipients at Brown University, higher than the national average of 27%.*
*The racial-ethnic minorities figure is the total number of graduates minus White, international (nonresident), and unknown-race graduates.
More Specific Behavioral Science Concentrations at Brown University
This Behavioral Science program at Brown University offers more specialized concentrations:
| Concentration | Graduates |
|---|---|
| Behavioral Sciences | 47 |
Best-Paid Careers for Behavioral Science Graduates
Graduates of the Behavioral Science program at Brown University go on to a range of careers. Below are the highest-paying careers for Behavioral Science graduates, ordered by median annual salary:
| Occupation | Nationwide Median Wage |
|---|---|
| Social and Community Service Managers | $156,089 |
| Psychology Teachers, Postsecondary | $98,479 |
| Life Scientists, All Other | $97,541 |
| Neuropsychologists | $83,690 |
| Community and Social Service Specialists, All Other | $75,358 |
| Psychologists, All Other | $73,521 |
| Clinical Neuropsychologists | $57,643 |
| Transportation Planners | $50,855 |
| Social Scientists and Related Workers, All Other | $42,168 |
| Social Science Research Assistants | $41,630 |
References
- IPEDS — Integrated Postsecondary Education Data System
- U.S. Department of Education — College Scorecard
- O*NET Online (Bureau of Labor Statistics)
- National Center for Education Statistics
More about our data sources and methodologies.
Course Advisor provides higher-education, college and university, degree, program, career, salary, and other helpful information to students, faculty, institutions, and other internet audiences. Presented information and data are subject to change. Inclusion on this website does not imply or represent a direct relationship with the company, school, or brand. Information, though believed correct at time of publication, may not be correct, and no warranty is provided. Contact the schools to verify any information before relying on it. Financial aid may be available for those who qualify. The displayed options may include sponsored or recommended results, not necessarily based on your preferences.
© Course Advisor – All Rights Reserved.