Agricultural Production at Austin Community College District
If you plan to study Agricultural Production, you may want to check out the program at Austin Community College District. The following information will help you decide if it is a good fit for you.
Austin Community College District sits in Austin, TX.
For the most recent IPEDS reporting year, 7 agricultural production degrees were granted at Austin Community College District.
Featured schools near , edit
Online Class Availability at Austin Community College District
Online coursework is an option at Austin Community College District. Of 39,727 students, 12,879 (32%) studied exclusively online and 11,320 (28%) took at least some classes online.
Student Demographics & Diversity
Take a look at the diversity of Agricultural Production graduates at Austin Community College District, by degree type.
Across all degree levels, Agricultural Production graduates at Austin Community College District are 43% women (3) and 57% men (4).
Agricultural Production Associate’s Program at Austin Community College District
Of the 7 associate’s agricultural production graduates at Austin Community College District, 43% were women (3) and 57% were men (4).

The following table and chart show the race/ethnicity of Agricultural Production associate’s degree recipients at Austin Community College District.
| Race / Ethnicity | Number of Graduates |
|---|---|
| White | 4 |
| Hispanic / Latino | 1 |
| Two or More Races | 2 |
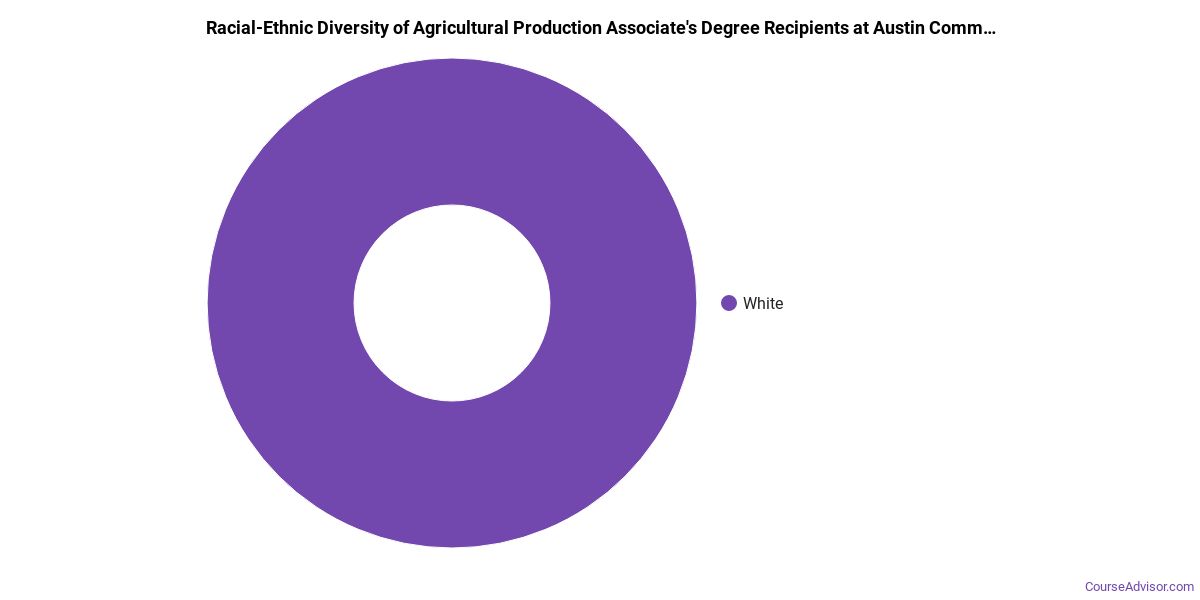
Minority students account for 43% of Agricultural Production associate’s degree recipients at Austin Community College District, above the national average of 35%.*
*The racial-ethnic minorities figure is the total number of graduates minus White, international (nonresident), and unknown-race graduates.
More Specific Agricultural Production Concentrations at Austin Community College District
This Agricultural Production program at Austin Community College District includes the following sub-specializations:
| Concentration | Graduates |
|---|---|
| Sustainable Agriculture | 7 |
Top-Paying Careers for Agricultural Production Graduates
Those who complete Agricultural Production program at Austin Community College District pursue many career paths. Below are the highest-paying careers for Agricultural Production majors, ordered by median annual salary:
| Occupation | Nationwide Median Wage |
|---|---|
| Animal Scientists | $93,823 |
| Farmers, Ranchers, and Other Agricultural Managers | $84,680 |
| Conservation Scientists | $81,436 |
| Forestry and Conservation Science Teachers, Postsecondary | $79,966 |
| Park Naturalists | $76,516 |
| Agricultural Sciences Teachers, Postsecondary | $66,903 |
| Range Managers | $59,935 |
| Soil and Plant Scientists | $59,587 |
| Farm and Home Management Educators | $55,950 |
| Animal Breeders | $49,553 |
References
- IPEDS — Integrated Postsecondary Education Data System
- U.S. Department of Education — College Scorecard
- O*NET Online (Bureau of Labor Statistics)
- National Center for Education Statistics
More about our data sources and methodologies.
Course Advisor provides higher-education, college and university, degree, program, career, salary, and other helpful information to students, faculty, institutions, and other internet audiences. Presented information and data are subject to change. Inclusion on this website does not imply or represent a direct relationship with the company, school, or brand. Information, though believed correct at time of publication, may not be correct, and no warranty is provided. Contact the schools to verify any information before relying on it. Financial aid may be available for those who qualify. The displayed options may include sponsored or recommended results, not necessarily based on your preferences.
© Course Advisor – All Rights Reserved.