General Agriculture at Angelo State University
If you are interested in studying General Agriculture, you may want to check out the program at Angelo State University. Get started with the following essential facts.
Angelo State University is located in San Angelo, TX.
For the most recent IPEDS reporting year, 17 general agriculture degrees were awarded at Angelo State University.
Featured schools near , edit
Online & Distance Learning at Angelo State University
Online coursework is an option at Angelo State University. Of 11,542 students, 2,302 (20%) were enrolled entirely in distance education and 3,003 (26%) took at least some classes online.
General Agriculture Rankings at Angelo State University
These rankings give you a sense of how Angelo State University’s General Agriculture program to other colleges that offer this major.
Bachelor’s-Level Rankings
| Ranking | Scope | Rank |
|---|---|---|
| Best Value | Texas | #3 of 11 |
| Best Schools (Quality) | Texas | #7 of 11 |
| Best Value | Southwest (Region) | #12 of 22 |
| Best Schools (Quality) | Southwest (Region) | #13 of 22 |
| Best Value | Nationwide | #38 of 84 |
| Best Schools (Quality) | Nationwide | #55 of 84 |
Master’s-Level Rankings
| Ranking | Scope | Rank |
|---|---|---|
| Best Value | Texas | #3 of 11 |
| Best Schools (Quality) | Texas | #7 of 11 |
| Best Value | Southwest (Region) | #12 of 22 |
| Best Schools (Quality) | Southwest (Region) | #13 of 22 |
| Best Value | Nationwide | #38 of 84 |
| Best Schools (Quality) | Nationwide | #55 of 84 |
Student Demographics & Diversity
Take a look at the student demographics for General Agriculture graduates at Angelo State University, by degree type.
Across all degree levels, General Agriculture graduates at Angelo State University are 71% women (12) and 29% men (5).
General Agriculture Bachelor’s Program at Angelo State University
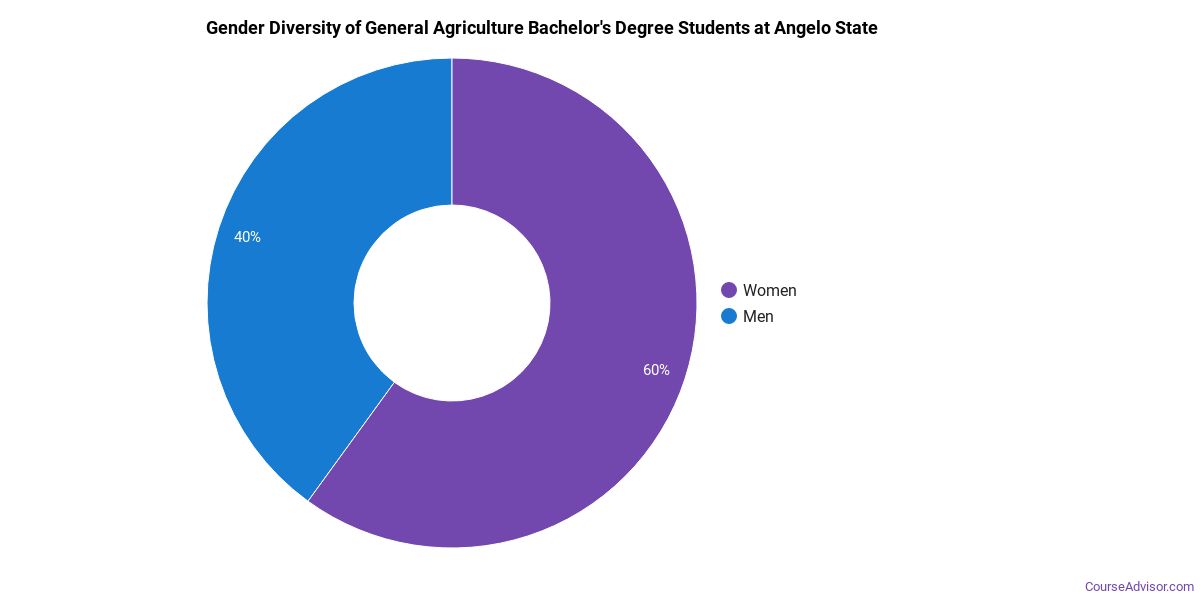
Among the 14 bachelor’s general agriculture degrees awarded at Angelo State University, 71% were women (10) and 29% were men (4).
The following table and chart show the race/ethnicity of General Agriculture bachelor’s degree recipients at Angelo State University.
| Race / Ethnicity | Number of Graduates |
|---|---|
| White | 7 |
| Hispanic / Latino | 4 |
| Two or More Races | 3 |
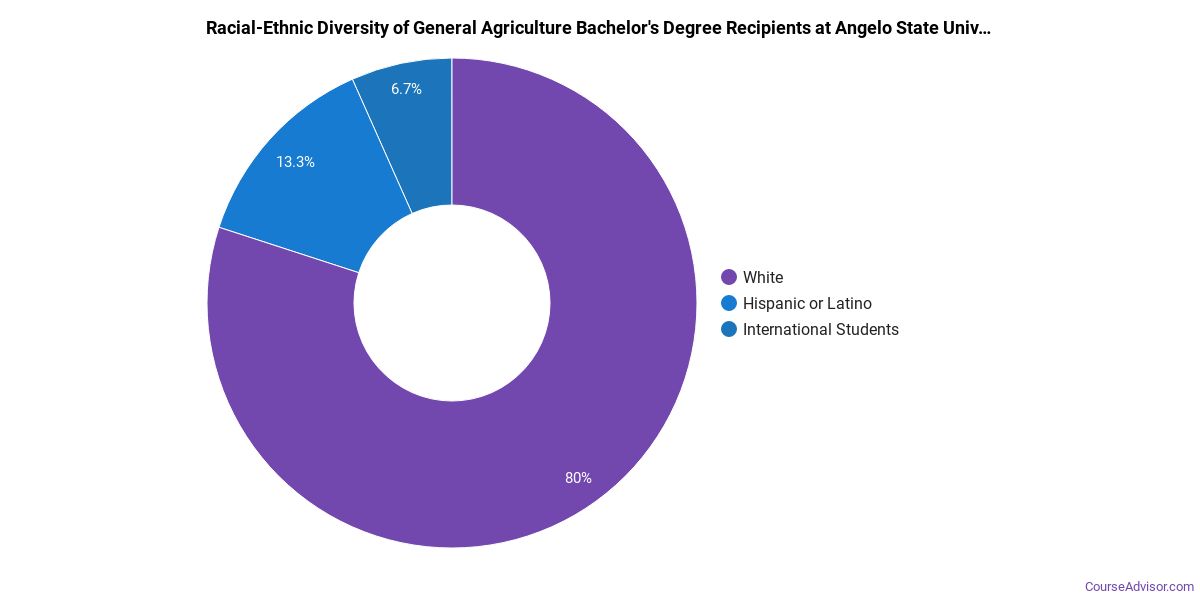
Minority students account for 50% of General Agriculture bachelor’s degree recipients at Angelo State University, above the national average of 36%.*
General Agriculture Master’s Program at Angelo State University
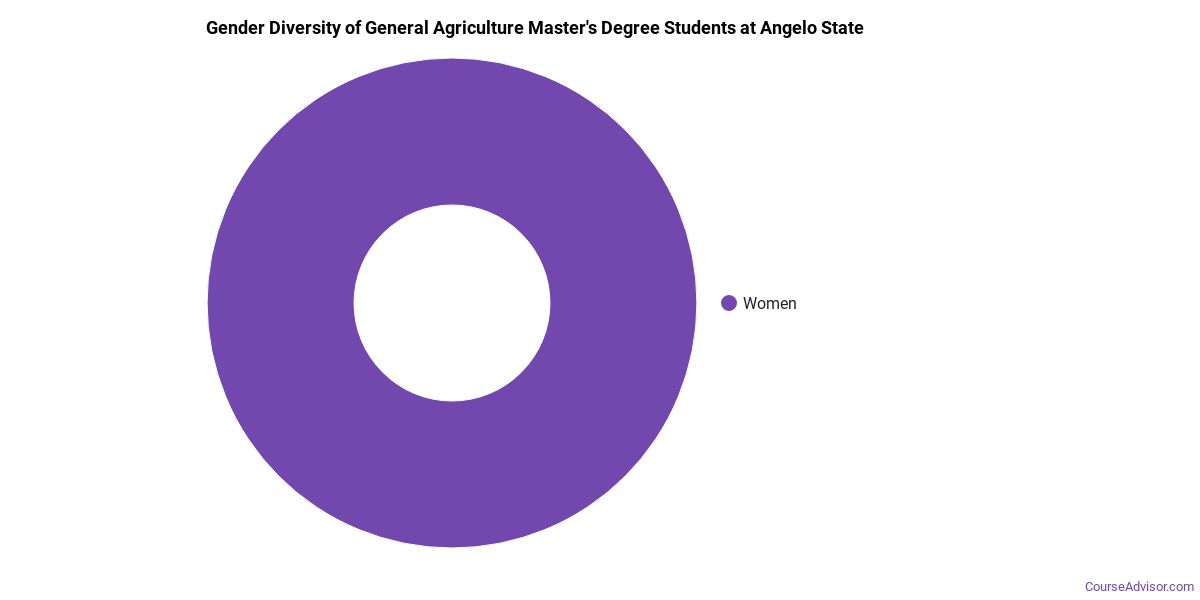
Of the 3 master’s general agriculture graduates at Angelo State University, 67% were women (2) and 33% were men (1).
The following table and chart show the race/ethnicity of General Agriculture master’s degree recipients at Angelo State University.
| Race / Ethnicity | Number of Graduates |
|---|---|
| White | 2 |
| Hispanic / Latino | 1 |
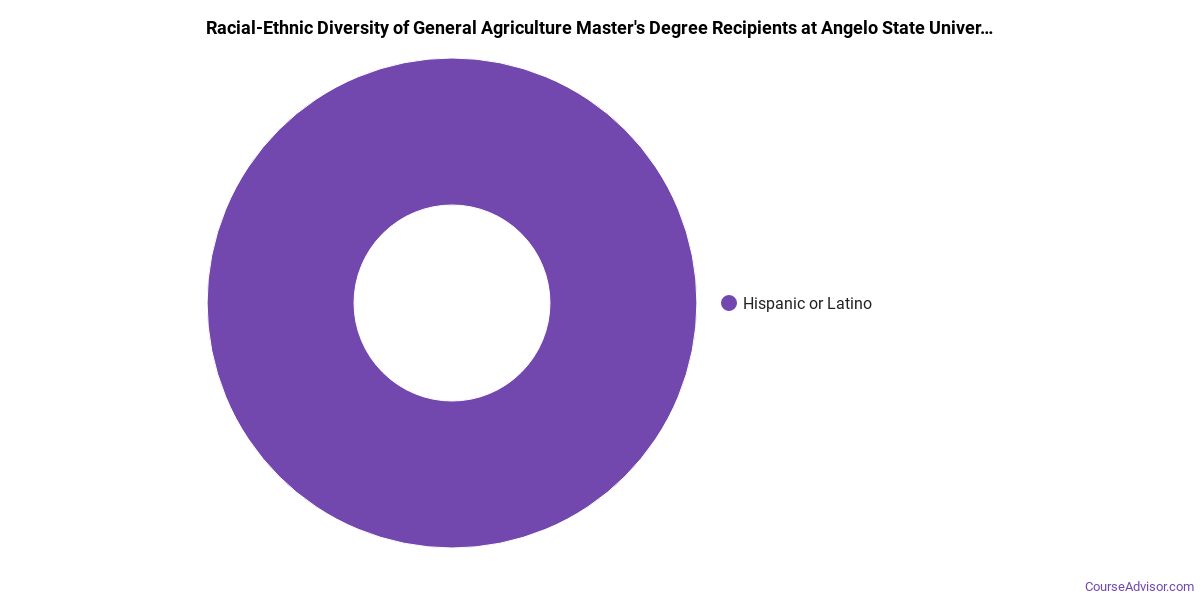
Racial-ethnic minorities make up 33% of General Agriculture master’s degree recipients at Angelo State University, above the national average of 30%.*
*The racial-ethnic minorities figure is the total number of graduates minus White, international (nonresident), and unknown-race graduates.
More Specific General Agriculture Concentrations at Angelo State University
This General Agriculture program at Angelo State University includes the following sub-specializations:
| Concentration | Graduates |
|---|---|
| Agriculture | 17 |
Highest-Paying Careers for General Agriculture Graduates
Those who complete General Agriculture program at Angelo State University pursue many career paths. Here are the best-paid careers for General Agriculture graduates, ordered by median annual salary:
| Occupation | Nationwide Median Wage |
|---|---|
| Animal Scientists | $93,823 |
| Agricultural Sciences Teachers, Postsecondary | $66,903 |
| Soil and Plant Scientists | $59,587 |
| Precision Agriculture Technicians | $56,932 |
| Food Scientists and Technologists | $55,930 |
| Agricultural Technicians | $44,022 |
References
- IPEDS — Integrated Postsecondary Education Data System
- U.S. Department of Education — College Scorecard
- O*NET Online (Bureau of Labor Statistics)
- National Center for Education Statistics
More about our data sources and methodologies.
Course Advisor provides higher-education, college and university, degree, program, career, salary, and other helpful information to students, faculty, institutions, and other internet audiences. Presented information and data are subject to change. Inclusion on this website does not imply or represent a direct relationship with the company, school, or brand. Information, though believed correct at time of publication, may not be correct, and no warranty is provided. Contact the schools to verify any information before relying on it. Financial aid may be available for those who qualify. The displayed options may include sponsored or recommended results, not necessarily based on your preferences.
© Course Advisor – All Rights Reserved.